
Page 210 - Special Topic Session (STS) - Volume 4
P. 210
STS580 Ross Sparks et. al
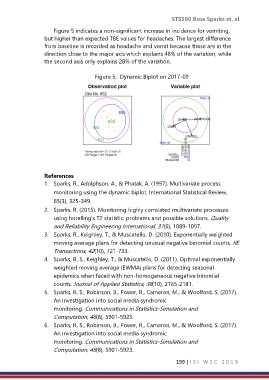
Figure 5 indicates a non-significant increase in incidence for vomiting,
but higher than expected TBE values for headaches. The largest difference
from baseline is recorded as headache and vomit because these are in the
direction close to the major axis which explains 48% of the variation, while
the second axis only explains 28% of the variation.
Figure 5: Dynamic Biplot on 2017-09
References
1. Sparks, R., Adolphson, A., & Phatak, A. (1997). Multivariate process
monitoring using the dynamic biplot. International Statistical Review,
65(3), 325-349.
2. Sparks, R. (2015). Monitoring highly correlated multivariate processes
using hotelling's T2 statistic: problems and possible solutions. Quality
and Reliability Engineering International, 31(6), 1089-1097.
3. Sparks, R., Keighley, T., & Muscatello, D. (2010). Exponentially weighted
moving average plans for detecting unusual negative binomial counts. IIE
Transactions, 42(10), 721-733.
4. Sparks, R. S., Keighley, T., & Muscatello, D. (2011). Optimal exponentially
weighted moving average (EWMA) plans for detecting seasonal
epidemics when faced with non-homogeneous negative binomial
counts. Journal of Applied Statistics, 38(10), 2165-2181.
5. Sparks, R. S., Robinson, B., Power, R., Cameron, M., & Woolford, S. (2017).
An investigation into social media syndromic
monitoring. Communications in Statistics-Simulation and
Computation, 46(8), 5901-5923.
6. Sparks, R. S., Robinson, B., Power, R., Cameron, M., & Woolford, S. (2017).
An investigation into social media syndromic
monitoring. Communications in Statistics-Simulation and
Computation, 46(8), 5901-5923.
199 | I S I W S C 2 0 1 9