
Page 68 - Special Topic Session (STS) - Volume 4
P. 68
STS563 Patrick Graham et al.
the list. However, our problem differs from that discussed by Zhang (2015),
because we assume a single list, supplemented by a survey, whereas Zhang
(2015) assumed a data structure comprising two (or more) lists and a sample
survey of the target population (which could be replaced by a third list known
only to suffer from undercoverage). Our focus is on small domain population
estimation and production of a corrected unit record file and we take a
Bayesian approach to inference. In contrast, Zhang (2015) concentrated on
frequentist estimation of total population size. A detailed account of our
methodology can be found in Graham and Lin (2019). Here we provide a brief
account of the main ideas and discuss some details of implementation,
particularly with respect to the sample survey of the target population. As in
Graham and Lin (2019) we ignore issues of measurement error or
misclassification of list variables and linkage error.
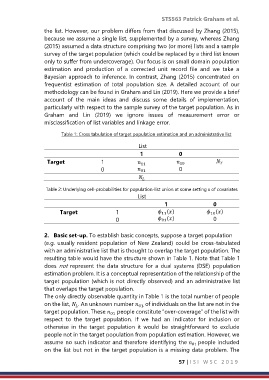
Table 1: Cross tabulation of target population estimation and an administrative list
List
1 0
Target 1
11
10
0 0
01
Table 2: Underlying cell-probabilities for population-list union at some setting x of covariates
List
1 0
Target 1 () ()
11
10
0 () 0
01
2. Basic set-up. To establish basic concepts, suppose a target population
(e.g. usually resident population of New Zealand) could be cross-tabulated
with an administrative list that is thought to overlap the target population. The
resulting table would have the structure shown in Table 1. Note that Table 1
does not represent the data structure for a dual systems (DSE) population
estimation problem. It is a conceptual representation of the relationship of the
target population (which is not directly observed) and an administrative list
that overlaps the target population.
The only directly observable quantity in Table 1 is the total number of people
on the list, . An unknown number 01 , of individuals on the list are not in the
target population. These people constitute “over-coverage” of the list with
01
respect to the target population. If we had an indicator for inclusion or
otherwise in the target population it would be straightforward to exclude
people not in the target population from population estimation. However, we
assume no such indicator and therefore identifying the 01 people included
on the list but not in the target population is a missing data problem. The
57 | I S I W S C 2 0 1 9