
Page 69 - Special Topic Session (STS) - Volume 4
P. 69
STS563 Patrick Graham et al.
missing data absent from the list are the indicators for inclusion in the target
population. If we could determine the over-coverage, 01 , then since the list
total, , is directly observed, we could immediately obtain the number of
people both in the target population and on the list as
= – . On the other hand, an unknown individuals are in the target
01
10
11
population but not on the list. This group represents the “under-coverage” of
the list with respect to the target population. If we could estimate , then
11
given an estimate, ̂ 10 of 10 we could obtain an estimate of the target
population total as
̂
̂
= ̂ 11 + ̂ 10 = − ̂ 01 + ̂ .
10
Ideally, we would like to estimate not just the total population size but the
number of people in the target population by characteristics such as age, sex,
ethnic group and area. Therefore, we assume a structure such as Table 1 for
each combination of these variables. We let X denote the covariates of interest
and X = x a particular combination of these variables.
Allowing for dependence on the covariates, Table 2, describes a probability
model underpinning the cross-tabulation of the target population and the list.
The probabilities for the three occupied cells in Table 2 sum to one. Under this
model, an individual in the target population-list union, with covariates x is
allocated to one of the three possible cells with the probabilities given in Table
2. Thus, at the unit level, we posit a multinomial model,with one trial. Given the
cell probabilities from Table 2 we can define the under-coverage probability,
Pr( not on list |in Target, X = x) as () = (x)/( (x) + (x)) and
11
10
10
the over coverage probability for the list, Pr( not in Target|on list, X = x) as
() = (x)/( (x) + (x)). Since (x) + (x) + (x) = 1 we
11
01
01
11
01
10
need specify only two of the cell probabilities to fully specify the multinomial
model implied by Table 2. A convenient approach is to model () and
(x). The remaining cell probabilities can then be obtained as (x) = (1 –
11
01
(x))(1 – ()), (x) = (1 – (x)) ().
01
01
10
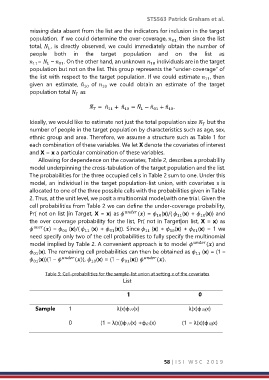
Table 3: Cell-probabilities for the sample-list union at setting x of the covariates
List
1 0
Sample 1 λ(x)φ11(x) λ(x)φ10(x)
0 (1 − λ(x))φ11(x) +φ01(x) (1 − λ(x))φ10(x)
58 | I S I W S C 2 0 1 9