
Page 74 - Special Topic Session (STS) - Volume 4
P. 74
STS563 Patrick Graham et al.
age, sex and area. Finally, we simulated a coverage survey by taking a two-
stage sample of 5% from the target population. We applied two selection
methods in the second sampling stage: a standard Stats NZ household survey
design approach of sampling 12 households from each sampled PSU, and an
alternative approach of selecting all households. For both scenarios we
assumed a household level response probability of 0.9 for PSUs, and no within
household non-response. The number of sampled PSUs was 1377 for the
former and 231 for the latter. We adopted weakly informative priors for all
model parameters, similar to the prior specifications given in Bryant et al (2017,
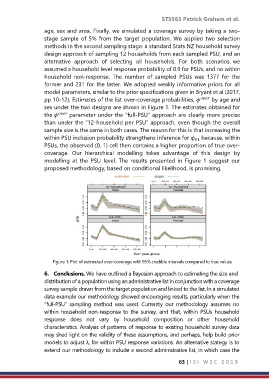
pp 10-12). Estimates of the list over-coverage probabilities, by age and
sex under the two designs are shown in Figure 1. The estimates obtained for
the parameter under the “full-PSU” approach are clearly more precise
than under the “12-household per PSU” approach, even though the overall
sample size is the same in both cases. The reason for this is that increasing the
within PSU inclusion probability strengthens inference for because, within
01
PSUs, the observed (0, 1) cell then contains a higher proportion of true over-
coverage. Our hierarchical modelling takes advantage of this design by
modelling at the PSU level. The results presented in Figure 1 suggest our
proposed methodology, based on conditional likelihood, is promising.
Figure 1: Plot of estimated over-coverage with 95% credible intervals compared to true values
6. Conclusions. We have outlined a Bayesian approach to estimating the size and
distribution of a population using an administrative list in conjunction with a coverage
survey sample drawn from the target population and linked to the list. In a simulated
data example our methodology showed encouraging results, particularly when the
”full-PSU” sampling method was used. Currently our methodology assumes no
within household non-response to the survey, and that, within PSUs household
response does not vary by household composition or other household
characteristics. Analysis of patterns of response to existing household survey data
may shed light on the validity of these assumptions, and perhaps, help build prior
models to adjust λ, for within PSU response variations. An alternative stategy is to
extend our methodology to include a second administrative list, in which case the
63 | I S I W S C 2 0 1 9