
Page 82 - Special Topic Session (STS) - Volume 4
P. 82
STS563 Davide Di Cecco et al.
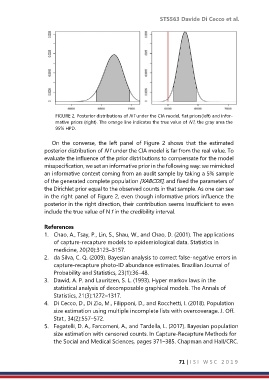
FIGURE 2. Posterior distributions of N1 under the CIA model, flat priors(left) and infor-
mative priors (right). The orange line indicates the true value of N1, the gray area the
95% HPD.
On the converse, the left panel of Figure 2 shows that the estimated
posterior distribution of N1 under the CIA model is far from the real value. To
evaluate the influence of the prior distributions to compensate for the model
misspecification, we set an informative prior in the following way: we mimicked
an informative context coming from an audit sample by taking a 5% sample
of the generated complete population [XABCDE], and fixed the parameters of
the Dirichlet prior equal to the observed counts in that sample. As one can see
in the right panel of Figure 2, even though informative priors influence the
posterior in the right direction, their contribution seems insufficient to even
include the true value of N1 in the credibility interval.
References
1. Chao, A., Tsay, P., Lin, S., Shau, W., and Chao, D. (2001). The applications
of capture-recapture models to epidemiological data. Statistics in
medicine, 20(20):3123–3157.
2. da Silva, C. Q. (2009). Bayesian analysis to correct false-negative errors in
capture-recapture photo-ID abundance estimates. Brazilian Journal of
Probability and Statistics, 23(1):36–48.
3. Dawid, A. P. and Lauritzen, S. L. (1993). Hyper markov laws in the
statistical analysis of decomposable graphical models. The Annals of
Statistics, 21(3):1272–1317.
4. Di Cecco, D., Di Zio, M., Filipponi, D., and Rocchetti, I. (2018). Population
size estimation using multiple incomplete lists with overcoverage. J. Off.
Stat., 34(2):557–572.
5. Fegatelli, D. A., Farcomeni, A., and Tardella, L. (2017). Bayesian population
size estimation with censored counts. In Capture-Recapture Methods for
the Social and Medical Sciences, pages 371–385. Chapman and Hall/CRC.
71 | I S I W S C 2 0 1 9