
Page 152 - Contributed Paper Session (CPS) - Volume 2
P. 152
CPS1485 Pasi P.
transport timetables and routing estimation platforms represent here the data
integration task (see: Piela 2017).
The actual travel time and distance estimation is computationally a
complex procedure. Here it has been solved by parallel computing:
PythonTM programs calling ESRI ArcGIS® Network Analyst Route Solver for
estimations of the shortest, travel time optimised, paths (hierarchical routing,
nonhierarchical in the case of walking or cycling). In the case of public
transport, web services’ (such as the nationwide Journey.fi, FTA (2018)) large
datasets have been retrieved via application programming interface.
All of the estimates are compiled to a micro level database. The database
includes the following variables to be merged with other demographic data:
Commuting distance and time by private vehicle, Cycling distance and time,
Public transport commuting distance and time (in the whole country), Helsinki
Region Public Transport commuting distance and time and Corrected
commuting time for trips to and from the central Helsinki area (Piela, P. and
Pasila, A., 2017).
Among these, bicycle commuting statistics have received most publicity.
Cycle commuting time median in Finland is 27 minutes (30 minutes in the
Capital Region): half of the population can cycle to their workplace within half
an hour.
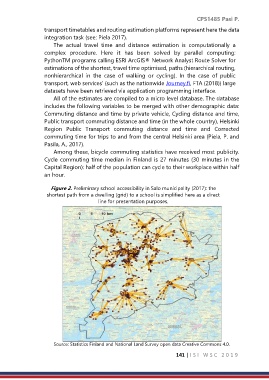
Figure 2. Preliminary school accessibility in Salo municipality (2017): the
shortest path from a dwelling (grid) to a school is simplified here as a direct
line for presentation purposes.
Source: Statistics Finland and National Land Survey open data Creative Commons 4.0.
141 | I S I W S C 2 0 1 9