
Page 154 - Contributed Paper Session (CPS) - Volume 2
P. 154
CPS1485 Pasi P.
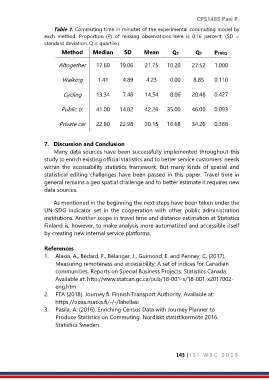
Table 1. Commuting time in minutes of the experimental commuting model by
each method. Proportion (P) of missing observations here is 0.16 percent. (SD =
standard deviation, Q = quartile.)
Method Median SD Mean Q1 Q3 PFREQ
Altogether 17.60 19.06 21.75 10.20 27.52 1.000
Walking 1.41 4.89 4.23 0.00 8.85 0.110
Cycling 13.34 7.48 14.54 8.06 20.48 0.427
Public tr. 41.00 14.82 42.26 35.00 46.00 0.093
Private car 22.80 22.98 30.15 16.68 34.26 0.368
7. Discussion and Conclusion
Many data sources have been successfully implemented throughout this
study to enrich existing official statistics and to better service customers’ needs
within the accessibility statistics framework. But many kinds of spatial and
statistical editing challenges have been passed in this paper. Travel time in
general remains a geo spatial challenge and to better estimate it requires new
data sources.
As mentioned in the beginning the next steps have been taken under the
UN SDG indicator set in the cooperation with other public administration
institutions. Another scope in travel time and distance estimation at Statistics
Finland is, however, to make analysis more automatized and accessible itself
by creating new internal service platforms.
References
1. Alasia, A., Bédard, F., Bélanger, J., Guimond, E. and Penney, C. (2017).
Measuring remoteness and accessibility: A set of indices for Canadian
communities. Reports on Special Business Projects. Statistics Canada.
Available at: http://www.statcan.gc.ca/pub/18-001-x/18-001-x2017002-
eng.htm
2. FTA (2018). Journey.fi. Finnish Transport Authority. Available at:
https://opas.matka.fi/-/-/lahellasi
3. Pasila, A. (2016). Enriching Census Data with Journey Planner to
Produce Statistics on Commuting. Nordiskt statistikermöte 2016.
Statistics Sweden.
143 | I S I W S C 2 0 1 9