
Page 180 - Contributed Paper Session (CPS) - Volume 2
P. 180
CPS1496 Tim Christopher D.L et al.
3. Result
Figure 1 shows the model performance under random and spatial cross-
validation for both Madagascar and Colombia. The poor model performance
in Colombia under spatial cross-validation indicates that the covariates alone
cannot explain malaria incidence in this area. For all other models that use the
machine learning predictions as covariates, correlations between observed
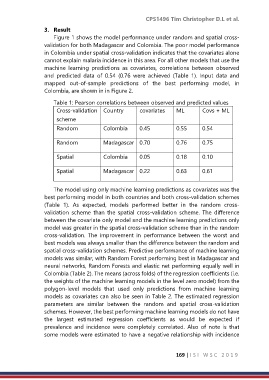
and predicted data of 0.54 {0.76 were achieved (Table 1). Input data and
mapped out-of-sample predictions of the best performing model, in
Colombia, are shown in in Figure 2.
Table 1: Pearson correlations between observed and predicted values
Cross-validation Country covariates ML Covs + ML
scheme
Random Colombia 0.45 0.55 0.54
Random Madagascar 0.70 0.76 0.75
Spatial Colombia 0.05 0.18 0.10
Spatial Madagascar 0.22 0.63 0.61
The model using only machine learning predictions as covariates was the
best performing model in both countries and both cross-validation schemes
(Table 1). As expected, models performed better in the random cross-
validation scheme than the spatial cross-validation scheme. The difference
between the covariate only model and the machine learning predictions only
model was greater in the spatial cross-validation scheme than in the random
cross-validation. The improvement in performance between the worst and
best models was always smaller than the difference between the random and
spatial cross-validation schemes. Predictive performance of machine learning
models was similar, with Random Forest performing best in Madagascar and
neural networks, Random Forests and elastic net performing equally well in
Colombia (Table 2). The means (across folds) of the regression coefficients (i.e.
the weights of the machine learning models in the level zero model) from the
polygon-level models that used only predictions from machine learning
models as covariates can also be seen in Table 2. The estimated regression
parameters are similar between the random and spatial cross-validation
schemes. However, the best performing machine learning models do not have
the largest estimated regression coefficients as would be expected if
prevalence and incidence were completely correlated. Also of note is that
some models were estimated to have a negative relationship with incidence
169 | I S I W S C 2 0 1 9