
Page 24 - Contributed Paper Session (CPS) - Volume 4
P. 24
CPS2106 Julio M. Singer et al.
treatments (MSC and Pericytes) relatively to that of the control treatment
(HBSS).
An example of predicted subject specific response curves is presented in
Figure 2.
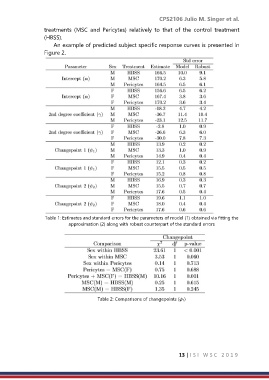
Table 1: Estimates and standard errors for the parameters of model (1) obtained via fitting the
approximation (2) along with robust counterpart of the standard errors
Table 2: Comparisons of changepoints (ψ 1)
13 | I S I W S C 2 0 1 9