
Page 322 - Contributed Paper Session (CPS) - Volume 4
P. 322
CPS2245 Azrie Tamjis
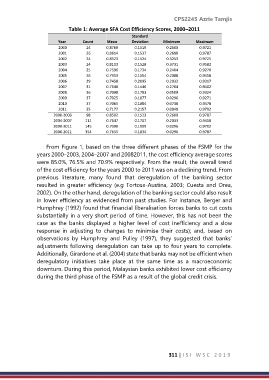
Table 1: Average SFA Cost Efficiency Scores, 2000–2011
Standard
Year Count Mean Deviation Minimum Maximum
2000 24 0.8760 0.1519 0.2600 0.9721
2001 26 0.8614 0.1537 0.2698 0.9787
2002 24 0.8523 0.1524 0.3253 0.9725
2003 24 0.8103 0.1528 0.3731 0.9582
2004 25 0.7596 0.1734 0.2404 0.9270
2005 26 0.7913 0.1554 0.2088 0.9418
2006 29 0.7450 0.2095 0.2033 0.9317
2007 31 0.7648 0.1440 0.2704 0.9402
2008 36 0.7098 0.1783 0.0509 0.9324
2009 37 0.7025 0.1877 0.0296 0.9271
2010 37 0.7065 0.1884 0.0738 0.9478
2011 35 0.7177 0.2157 0.0848 0.9702
2000-2003 98 0.8502 0.1523 0.2600 0.9787
2004-2007 111 0.7647 0.1707 0.2033 0.9418
2008-2011 145 0.7090 0.1909 0.0296 0.9702
2000-2011 354 0.7655 0.1834 0.0296 0.9787
From Figure 1, based on the three different phases of the FSMP for the
years 2000–2003, 2004–2007 and 20082011, the cost efficiency average scores
were 85.0%, 76.5% and 70.9% respectively. From the result, the overall trend
of the cost efficiency for the years 2000 to 2011 was on a declining trend. From
previous literature, many found that deregulation of the banking sector
resulted in greater efficiency (e.g Tortosa-Austina, 2003; Cuesta and Orea,
2002). On the other hand, deregulation of the banking sector could also result
in lower efficiency as evidenced from past studies. For instance, Berger and
Humphrey (1992) found that financial liberalisation forces banks to cut costs
substantially in a very short period of time. However, this has not been the
case as the banks displayed a higher level of cost inefficiency and a slow
response in adjusting to changes to minimise their costs); and, based on
observations by Humphrey and Pulley (1997), they suggested that banks’
adjustments following deregulation can take up to four years to complete.
Additionally, Girardone et al. (2004) state that banks may not be efficient when
deregulatory initiatives take place at the same time as a macroeconomic
downturn. During this period, Malaysian banks exhibited lower cost efficiency
during the third phase of the FSMP as a result of the global credit crisis.
311 | I S I W S C 2 0 1 9