
Page 374 - Contributed Paper Session (CPS) - Volume 4
P. 374
CPS2292 Roger S. Zoh, PhD et al.
4. Discussion and Conclusion
Trinh et al. (2013) recently studied the relationship between baseline
energy expenditure and the threeyear change in BMI among 182 five to ten
year old children with overweight and obesity health conditions in Australia.
Using regression analysis and change in BMI Z-scores, the authors concluded
that baseline measures of energy expenditure significantly impacted the
three-year change in BMI among the children. However, our current results
indicated that baseline levels of energy expenditure did have some statistically
significant relationships on the future body weights among children, however,
these impacts depended on activity levels and the time of activity. In this
manuscript, we developed an instrumental variable approach for addressing
potential measurement errors associated with function-valued covariates in
scalar on function regression models. The developed methods can be used for
assessments of the impacts of data collected on biological markers obtained
repeatedly over a dense time space on health outcomes. A limitation of our
current approach is that the instrumental variable must be collected on the
same time period as the unbiased measure for the true covariate. Thus, the
developed methods are applicable for devices that collect data on multiple
biological markers over the same time period.
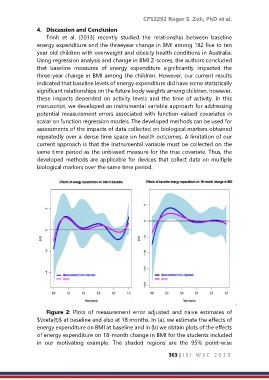
Figure 2: Plots of measurement error adjusted and naive estimates of
$\beta(t)$ at baseline and also at 18 months. In (a), we estimate the effects of
energy expenditure on BMI at baseline and in (b) we obtain plots of the effects
of energy expenditure on 18-month change in BMI for the students included
in our motivating example. The shaded regions are the 95% point-wise
363 | I S I W S C 2 0 1 9