
Page 441 - Contributed Paper Session (CPS) - Volume 4
P. 441
CPS2526 Holger Cevallos-Valdiviezo et al.
mean prediction errors for outlying data and clean data separately ( and
̅̅̅̅̅
). An FPCA method that is robust will give a high value and a low
̅̅̅̅̅̅̅̅
̅̅̅̅̅
value.
̅̅̅̅̅̅̅̅
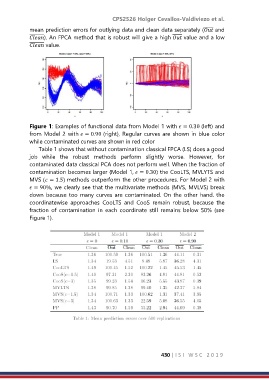
Figure 1: Examples of functional data from Model 1 with = 0.30 (left) and
from Model 2 with = 0.90 (right), Regular curves are shown in blue color
while contaminated curves are shown in red color
Table 1 shows that without contamination classical FPCA (LS) does a good
job while the robust methods perform slightly worse. However, for
contaminated data classical PCA does not perform well. When the fraction of
contamination becomes larger {Model 1, = 0.30) the CooLTS, MVLYTS and
MVS ( = 1.5) methods outperform the other procedures. For Model 2 with
= 90%, we clearly see that the multivariate methods (MVS, MVLVS) break
down because too many curves are contaminated. On the other hand. the
coordinatewise approaches CooLTS and CooS remain robust, because the
fraction of contamination in each coordinate still remains below 50% (see
Figure 1).
430 | I S I W S C 2 0 1 9