Page 101 - Contributed Paper Session (CPS) - Volume 7
P. 101

CPS2040 Makoto Tomita

                        80                                                  14
                        70                                                  12
                        60
                                                                            10
                        50
                                                                            8
                        40
                                                                            6
                        30
                                                                            4
                        20
                        10                                                  2
                         0                                                  0
                             2010  2011  2012  2013  2014  2015  2016  2017

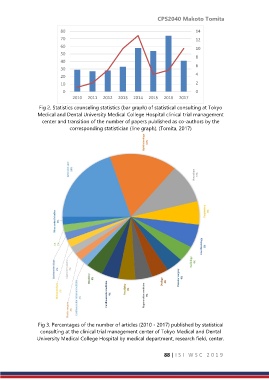
                Fig 2. Statistics counseling statistics (bar graph) of statistical consulting at Tokyo
               Medical and Dental University Medical College Hospital clinical trial management
                 center and transition of the number of papers published as co-authors by the
                            corresponding statistician (line graph). (Tomita, 2017)


                Fig 3. Percentages of the number of articles (2010 - 2017) published by statistical
                consulting at the clinical trial management center of Tokyo Medical and Dental
               University Medical College Hospital by medical department, research field, center.


                                                                88 | I S I   W S C   2 0 1 9
   96   97   98   99   100   101   102   103   104   105   106