Page 208 - Contributed Paper Session (CPS) - Volume 7
P. 208

CPS2062 Nurul Fatihah M. et al.
                Expenditure      1993/94*   1998/99*   2004/05   2009/10   2014    2016
                group                                       RM
                Food and non-
                alcoholic                 276            368            393            444            676            726
                beverages
                Alcoholic
                beverages and               26              30              35              48              83              98
                tobacco
                Clothing and                41              56              59              75            124            136
                footwear
                Housing, water,
                electricity, gas            245            363            430            495            853            969
                and other fuels
                Furnishings,
                household                   65              84              83              89            137            168
                equipment and
                routine
                Health                      21              29              27              29              59              75
                Transport                 168            227            314            327            523            553
                Communication               24              59            103            124            189            203
                Recreation
                services and                53              70              92            101            174            200
                culture
                Education                   17              31              38              31              41              54
                Restaurants and
                hotels                    145            209            213            239            454            540
                Miscellaneous
                goods and                   78            105            167            190            266            312
                services
                Mean monthly
                household              1,161         1,631         1,953         2,190         3,578         4,033
                consumption
                expenditure
                 Table 3.1: Composition of mean monthly household consumption expenditure by
                                            expenditure group

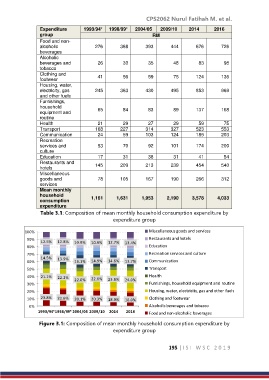
           100%                                           Miscellaneous goods and services
           90%                                            Restaurants and hotels
                 12.5%  12.8%  10.9%  10.9%  12.7%  13.4%
           80%                                            Education
           70%                                            Recreation services and culture
                 14.5%  13.9%
           60%                16.1%  14.9%  14.6%  13.7%  Communication
           50%                                            Transport
           40%   21.1%  22.2%                             Health
                              22.0%  22.6%  23.8%  24.0%
           30%                                            Furnishings, household equipment and routine
           20%                                            Housing, water, electricity, gas and other fuels
           10%   23.8%  22.6%  20.1%  20.3%  18.9%  18.0%  Clothing and footwear
            0%                                            Alcoholic beverages and tobacco
                1993/94*1998/99* 2004/05 2009/10  2014  2016  Food and non-alcoholic beverages

                Figure 3.1: Composition of mean monthly household consumption expenditure by
                                            expenditure group


                                                                  195 | I S I   W S C   2 0 1 9
   203   204   205   206   207   208   209   210   211   212   213