
Page 209 - Contributed Paper Session (CPS) - Volume 7
P. 209
CPS2062 Nurul Fatihah M. et al.
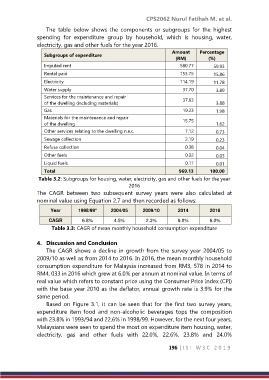
The table below shows the components or subgroups for the highest
spending for expenditure group by household, which is housing, water,
electricity, gas and other fuels for the year 2016.
Amount Percentage
Subgroups of expenditure
(RM) (%)
Imputed rent 580.77 59.93
Rental paid 153.75 15.86
Electricity 114.19 11.78
Water supply 37.70 3.89
Services for the maintenance and repair 37.63
of the dwelling (including materials) 3.88
Gas 19.23 1.98
Materials for the maintenance and repair 15.75
of the dwelling 1.62
Other services relating to the dwelling n.e.c. 7.12 0.73
Sewage collection 2.19 0.23
Refuse collection 0.38 0.04
Other fuels 0.32 0.03
Liquid fuels 0.11 0.01
Total 969.13 100.00
Table 3.2: Subgroups for housing, water, electricity, gas and other fuels for the year
2016
The CAGR between two subsequent survey years were also calculated at
nominal value using Equation 2.7 and then recorded as follows:
Year 1998/99* 2004/05 2009/10 2014 2016
CAGR 6.8% 4.5% 2.3% 9.8% 6.0%
Table 3.3: CAGR of mean monthly household consumption expenditure
4. Discussion and Conclusion
The CAGR shows a decline in growth from the survey year 2004/05 to
2009/10 as well as from 2014 to 2016. In 2016, the mean monthly household
consumption expenditure for Malaysia increased from RM3, 578 in 2014 to
RM4, 033 in 2016 which grew at 6.0% per annum at nominal value. In terms of
real value which refers to constant price using the Consumer Price Index (CPI)
with the base year 2010 as the deflator, annual growth rate is 3.9% for the
same period.
Based on Figure 3.1, it can be seen that for the first two survey years,
expenditure item food and non-alcoholic beverages tops the composition
with 23.8% in 1993/94 and 22.6% in 1998/99. However, for the next four years,
Malaysians were seen to spend the most on expenditure item housing, water,
electricity, gas and other fuels with 22.0%, 22.6%, 23.8% and 24.0%
196 | I S I W S C 2 0 1 9