
Page 214 - Contributed Paper Session (CPS) - Volume 7
P. 214
CPS2065 Lina Schelin et al.
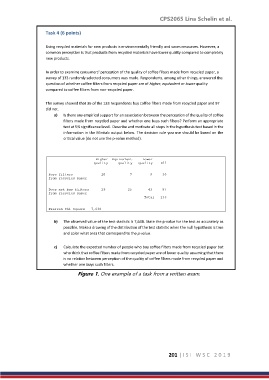
Task 4 (6 points)
Using recycled materials for new products is environmentally friendly and saves resources. However, a
common perception is that products from recycled materials have lower quality compared to completely
new products.
In order to examine consumers' perception of the quality of coffee filters made from recycled paper, a
survey of 133 randomly selected consumers was made. Respondents, among other things, answered the
question of whether coffee filters from recycled paper are of higher, equivalent or lower quality
compared to coffee filters from non-recycled paper.
The survey showed that 36 of the 133 respondents buy coffee filters made from recycled paper and 97
did not.
a) Is there any empirical support for an association between the perception of the quality of coffee
filters made from recycled paper and whether one buys such filters? Perform an appropriate
test at 5% significance level. Describe and motivate all steps in the hypothesis test based in the
information in the Minitab output below. The decision rule you use should be based on the
critical value (do not use the p-value method).
Higher Equivalent Lower
quality quality quality All
Buys filters 20 7 9 36
from recycled paper
Does not buy filters 29 25 43 97
from recycled paper
Total 133
Pearson Chi-Square = 7,638
b) The observed value of the test statistic is 7,638. State the p-value for the test as accurately as
possible. Make a drawing of the distribution of the test statistic when the null hypothesis is true
and color what area that correspond to the p-value.
c) Calculate the expected number of people who buy coffee filters made from recycled paper but
who think that coffee filters made from recycled paper are of lower quality assuming that there
is no relation between perception of the quality of coffee filters made from recycled paper and
whether one buys such filters.
Figure 1. One example of a task from a written exam.
201 | I S I W S C 2 0 1 9