
Page 27 - Contributed Paper Session (CPS) - Volume 7
P. 27
CPS2020 Honeylet T. S.
generating the means of Z are: (a) = 0.15 and = 0.05 or (b) = =
1
2
2
1
0.12.
After generating a complete dataset which will be the benchmark for
comparisons, the next steps will be done to the same complete dataset to
simulate scenarios. For simulation summary, please refer to Table 1.
1) One of the X variables will be discarded. Either X1 or X2 will be used as
common variable.
2) Random missing values will be assigned to variable Z. The percentage of
missing values will be part of scenario cases. These are 10%, 30%, 50%,
70%, and 90%.
3) The dataset will be separated into Data Source A and Data Source B.
Observation units with Z missing will comprise Data Source A, while the
rest of the observation units will comprise Data Source B. Hence, if the
percentage of missing values in variable Z is 10%, then Data Source A
with with A number of observations will comprise 10% of the total
sample size while Data Source B with B observations will comprise
90% of the total sample size .
Subsequently, matching procedures will then be applied to Data Source A
with missing Z values and Data Source B with missing Y values. Then,
estimation procedures will be used to estimate the coefficients of model (2.1).
Each simulation scenario will have 100 replicates.
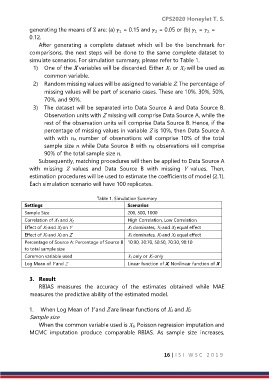
Table 1. Simulation Summary
Settings Scenarios
Sample Size 200, 500, 1000
Correlation of X 1 and X 2 High Correlation, Low Correlation
Effect of X 1 and X 2 on Y X 1 dominates, X 1 and X 2 equal effect
Effect of X 1 and X 2 on Z X 1 dominates, X 1 and X 2 equal effect
Percentage of Source A: Percentage of Source B 10:90, 30:70, 50:50, 70:30, 90:10
to total sample size
Common variable used X 1 only or X 2 only
Log Mean of Y and Z Linear function of X, Nonlinear function of X
3. Result
RBIAS measures the accuracy of the estimates obtained while MAE
measures the predictive ability of the estimated model.
1. When Log Mean of Y and Z are linear functions of X1 and X2
Sample size
When the common variable used is X1, Poisson regression imputation and
MCMC imputation produce comparable RBIAS. As sample size increases,
16 | I S I W S C 2 0 1 9