
Page 278 - Contributed Paper Session (CPS) - Volume 7
P. 278
CPS2099 Takatsugu Yoshioka et al.
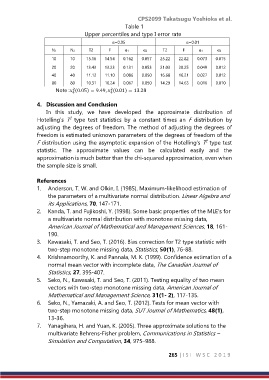
Table 1
Upper percentiles and type I error rate
α=0.05 α=0.01
N1 N2 T2 F α1 α2 T2 F α1 α2
10 10 15.16 14.54 0.162 0.057 25.22 22.82 0.073 0.015
20 20 13.43 13.23 0.131 0.053 21.03 20.25 0.049 0.012
40 40 11.12 11.10 0.086 0.050 16.68 16.21 0.027 0.012
80 80 10.31 10.24 0.067 0.050 14.29 14.63 0.016 0.010
2
Note : (0.05) = 9.49, (0.01) = 13.28
2
4
4
4. Discussion and Conclusion
In this study, we have developed the approximate distribution of
Hotelling’s T type test statistics by a constant times an F distribution by
2
adjusting the degrees of freedom. The method of adjusting the degrees of
freedom is estimated unknown parameters of the degrees of freedom of the
F distribution using the asymptotic expansion of the Hotelling’s T type test
2
statistic. The approximate values can be calculated easily and the
approximation is much better than the chi-squared approximation, even when
the sample size is small.
References
1. Anderson, T. W. and Olkin, I. (1985). Maximum-likelihood estimation of
the parameters of a multivariate normal distribution. Linear Algebra and
its Applications, 70, 147-171.
2. Kanda, T. and Fujikoshi, Y. (1998). Some basic properties of the MLE’s for
a multivariate normal distribution with monotone missing data,
American Journal of Mathematical and Management Sciences, 18, 161-
190.
3. Kawasaki, T. and Seo, T. (2016). Bias correction for T2 type statistic with
two-step monotone missing data, Statistics, 50(1), 76-88.
4. Krishnamoorthy, K. and Pannala, M. K. (1999). Confidence estimation of a
normal mean vector with incomplete data, The Canadian Journal of
Statistics, 27, 395-407.
5. Seko, N., Kawasaki, T. and Seo, T. (2011). Testing equality of two mean
vectors with two-step monotone missing data, American Journal of
Mathematical and Management Science, 31(1- 2), 117-135.
6. Seko, N., Yamazaki, A. and Seo, T. (2012). Tests for mean vector with
two-step monotone missing data, SUT Journal of Mathematics, 48(1),
13-36.
7. Yanagihara, H. and Yuan, K. (2005). Three approximate solutions to the
multivariate Behrens-Fisher problem, Communications in Statistics –
Simulation and Computation, 34, 975–988.
265 | I S I W S C 2 0 1 9