
Page 38 - Contributed Paper Session (CPS) - Volume 7
P. 38
CPS2021 Noor Ismawati et al.
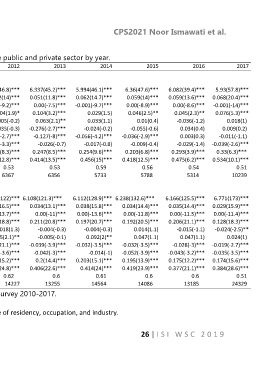
Table 1: The regression output of paid female employees in the public and private sector by year.
Variable 2010 2011 2012 2013 2014 2015 2016 2017
Public Sector
Constant 5.665(51.5)*** 5.599(52.8)*** 5.816(46.8)*** 6.337(45.2)*** 5.994(46.1)*** 6.36(47.6)*** 6.082(39.4)*** 5.93(57.8)***
Age 0.00(-7.6)*** -0.001(-10.2)*** 0.062(14)*** 0.051(11.8)*** 0.062(14.7)*** 0.059(14)*** 0.059(13.6)*** 0.068(20.4)***
2
Age 0.054(12.7)*** 0.062(15.6)*** -0.001(-9.2)*** 0.00(-7.5)*** -0.001(-9.7)*** 0.00(-8.9)*** 0.00(-8.6)*** -0.001(-14)***
Chinese 0.033(1.7)* 0.005(0.3) 0.04(1.9)* 0.104(3.2)*** 0.029(1.5) 0.046(2.5)** 0.045(2.3)** 0.076(5.3)***
Indian -0.034(-1.3) -0.015(-0.6) -0.005(-0.2) 0.063(2.1)** 0.033(1.1) 0.01(0.4) -0.036(-1.2) 0.018(1)
Others 0.024(0.3) 0.039(0.3) -0.035(-0.3) -0.276(-2.7)*** -0.024(-0.2) -0.055(-0.6) 0.034(0.4) 0.009(0.2)
Never married -0.038(-3)*** -0.039(-3.4)*** -0.035(-2.7)*** -0.127(-8)*** -0.056(-4.2)*** -0.036(-2.9)*** 0.003(0.3) -0.011(-1.1)
Widowed/Separated/Divorced -0.057(-2.7)*** -0.068(-3.3)*** -0.073(-3.3)*** -0.026(-0.7) -0.017(-0.8) -0.009(-0.4) -0.029(-1.4) -0.039(-2.6)***
Secondary 0.664(13.9)*** 0.594(12.4)*** 0.48(8.3)*** 0.247(8.5)*** 0.254(9.6)*** 0.203(6.8)*** 0.293(3.9)*** 0.33(6.3)***
Tertiary 0.885(18)*** 0.814(16.6)*** 0.758(12.8)*** 0.414(13.5)*** 0.456(15)*** 0.418(12.5)*** 0.475(6.2)*** 0.534(10.1)***
The R Square 0.56 0.56 0.53 0.53 0.59 0.56 0.54 0.51
Sample size 6218 6417 6367 6356 5733 5788 5314 10239
Private Sector
Constant 5.653(109.9)*** 5.741(117.2)*** 5.863(122)*** 6.108(121.3)*** 6.112(128.9)*** 6.238(132.6)*** 6.166(125.5)*** 6.771(173)***
Age -0.001(-14.6)*** 0.00(-13.9)*** 0.042(16.5)*** 0.034(13.1)*** 0.038(15.8)*** 0.034(14.4)*** 0.035(14.4)*** 0.029(15.9)***
Age 0.049(18)*** 0.044(16.9)*** 0.00(-13.7)*** 0.00(-11)*** 0.00(-13.6)*** 0.00(-11.8)*** 0.00(-11.5)*** 0.00(-11.4)***
2
Chinese 0.191(18.5)*** 0.205(21.4)*** 0.182(18.8)*** 0.211(20.8)*** 0.197(20.7)*** 0.192(20.5)*** 0.206(21.1)*** 0.128(18.3)***
Indian -0.031(-2.2)** -0.045(-3.3)*** 0.018(1.3) -0.004(-0.3) -0.004(-0.3) 0.014(1.1) -0.015(-1.1) -0.024(-2.5)**
Others 0.013(0.3) 0.038(0.8) 0.095(2.1)** -0.005(-0.1) 0.092(2)** 0.047(1.1) 0.047(1.1) 0.024(1)
Never married -0.01(-1) -0.035(-3.7)*** 0.206(21.1)*** -0.039(-3.9)*** -0.032(-3.5)*** -0.032(-3.5)*** -0.028(-3)*** -0.019(-2.7)***
Widowed/Separated/Divorced -0.12(-7.9)*** -0.063(-4.2)*** -0.049(-3.6)*** -0.042(-3)*** -0.014(-1) -0.052(-3.9)*** -0.043(-3.2)*** -0.035(-3.5)***
Secondary 0.225(15.4)*** 0.268(19.2)*** 0.207(15.2)*** 0.2(14.4)*** 0.203(15.1)*** 0.195(13.9)*** 0.175(12.2)*** 0.174(15.6)***
Tertiary 0.435(23)*** 0.505(28.2)*** 0.443(24.8)*** 0.406(22.6)*** 0.414(24)*** 0.419(23.9)*** 0.377(21.1)*** 0.384(28.6)***
The R Square 0.61 0.61 0.62 0.6 0.61 0.6 0.6 0.51
Sample size 13308 14426 14227 13255 14564 14086 13185 24329
Source: Department of Statistics Malaysia, Salaries and Wages Survey 2010-2017.
Note: Coefficient (t-statistics)
Other variables used but not shown, comprise of area and state of residency, occupation, and industry.
Significant at *10%, **5% and ***1%.
26 | I S I W S C 2 0 1 9