
Page 384 - Contributed Paper Session (CPS) - Volume 7
P. 384
CPS2138 RidaAgustina et al.
The analysis used is Structural Equation Modelling (SEM). Samples in this
study are 34 provinces in Indonesia, therefore researchers used the Latent
Variable Score (LVS) method as suggested by Wijanto (2015). The study was
conducted by analysing each dimension to check the validity and reliability of
each independent variable with Robust Estimation. After that every dimension
and indicator that is valid and reliable is combined then analysed and seen
how the overall suitability of each model is based on goodness of fit values.
The software program used is LISREL 9.1. Analysis is carried out for
parameter estimation, testing the overall suitability of the model, and
evaluating the overall suitability between the data and the model.
Independent variables or dimensions that does not have a significant effect
will be excluded from the model so that the valid and reliable dimensions and
indicators are obtained.
3. Result
Based on AHP calculation, there are 5 provinces in Indonesia that have very
high P-FRI values including Central Java (75.33), Bali (75.37), South Kalimantan
(75.57), East Kalimantan (76.10), Riau Islands (77.56), and DI Yogyakarta
(79.56). In addition, 3 provinces have low and very low PFRI values are: West
Nusa Tenggara (64.99), East Nusa Tenggara (62.12), and Papua (56.56).
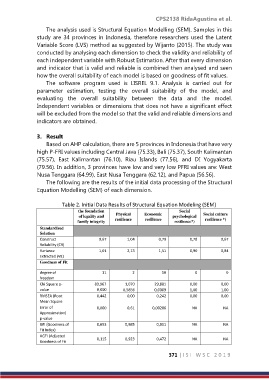
The following are the results of the initial data processing of the Structural
Equation Modelling (SEM) of each dimension.
Table 2. Initial Data Results of Structural Equation Modeling (SEM)
the foundation Social
of legality and Physical Economic psychological Social culture
family integrity resilience resilience resilience*) resilience *)
Standardized
Solution
Construct 0,67 1,04 0,79 0,78 0,67
Reliability (CR)
Variance 1,01 2,13 1,51 0,90 0,84
Extracted (VE)
Goodness of Fit
degree of 11 2 10 0 0
freedom
Chi Square p- 83,967 1,070 29,881 0,00 0,00
value 0,000 0,5856 0,0009 1,00 1,00
RMSEA (Root 0,442 0,00 0,242 0,00 0,00
Mean Square
Error of 0,000 0,61 0,00206 NA NA
Approximation)
p-value
GFI (Goodness of 0,653 0,985 0,811 NA NA
Fit Index)
AGFI (Adjusted 0,115 0,923 0,472 NA NA
Goodness of Fit
371 | I S I W S C 2 0 1 9