
Page 401 - Contributed Paper Session (CPS) - Volume 7
P. 401
CPS2141 Lim Kok-Hwa et al.
specialised functions for statistical operations particularly in econometric
modelling and business performance analysis. Correlation analysis has been
applied in order to identify the relationship among indicators in the time series
data for both GDP at Malaysia level and Negeri Sembilan state level
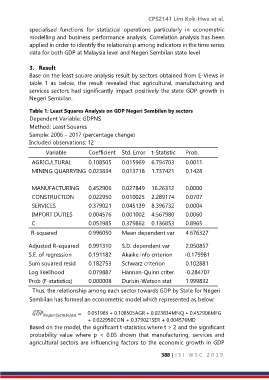
3. Result
Base on the least square analysis result by sectors obtained from E-Views in
table 1 as below, the result revealed that agricultural, manufacturing and
services sectors had significantly impact positively the state GDP growth in
Negeri Sembilan.
Table 1: Least Squares Analysis on GDP Negeri Sembilan by sectors
Dependent Variable: GDPNS
Method: Least Squares
Sample: 2006 – 2017 (percentage change)
Included observations: 12
Variable Coefficient Std. Error t-Statistic Prob.
AGRICULTURAL 0.108505 0.015969 6.794703 0.0011
MINING QUARRYING 0.023834 0.013718 1.737421 0.1428
MANUFACTURING 0.452906 0.027849 16.26312 0.0000
CONSTRUCTION 0.022950 0.010025 2.289174 0.0707
SERVICES 0.379021 0.045139 8.396732 0.0004
IMPORT DUTIES 0.004576 0.001002 4.567980 0.0060
C 0.051985 0.379862 0.136853 0.8965
R-squared 0.996050 Mean dependent var 4.676327
Adjusted R-squared 0.991310 S.D. dependent var 2.050857
S.E. of regression 0.191182 Akaike info criterion -0.179981
Sum squared resid 0.182753 Schwarz criterion 0.102881
Log likelihood 0.079887 Hannan-Quinn criter. -0.284707
Prob (F-statistics) 0.000008 Durbin-Watson stat 1.999832
Thus, the relationship among each sector towards GDP by State for Negeri
Sembilan has formed an econometric model which represented as below:
̂
= 0.051985 + 0.108505AGR + 0.023834MNQ + 0.452906MFG
+ 0.022950CON + 0.379021SER + 0.004576MD
Based on the model, the significant t-statistics where t > 2 and the significant
probability value where p < 0.05 shown that manufacturing, services and
agricultural sectors are influencing factors to the economic growth in GDP
388 | I S I W S C 2 0 1 9