
Page 403 - Contributed Paper Session (CPS) - Volume 7
P. 403
CPS2141 Lim Kok-Hwa et al.
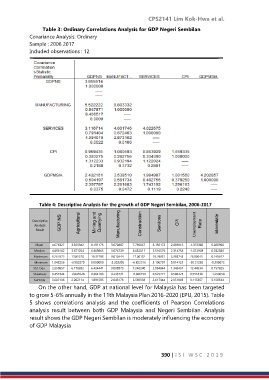
Table 3: Ordinary Correlations Analysis for GDP Negeri Sembilan
Covariance Analysis: Ordinary
Sample : 2006 2017
Included observations : 12
Table 4: Descriptive Analysis for the growth of GDP Negeri Sembilan, 2006-2017
Descriptive
Analysis
Result
Mean 4.676327 3.355942 8.191173 3.070887 7.785067 6.192173 2.669816 -1.372385 0.020960
Median 4.696182 3.671254 6.469865 3.076739 8.632011 5.516579 2.314738 -1.612903 0.032380
Maximum 9.262872 13.85576 19.32793 9.010444 17.00132 10.29931 5.393743 25.80645 0.248917
Minimum 1.042256 -6.995270 0.000000 -2.353305 -6.822516 3.196707 0.614125 -20.51282 -0.390072
Std. Dev. 2.050857 6.178692 6.424441 3.098973 7.240240 2.094844 1.345431 12.44534 0.157825
Skewness 0.457324 -0.041028 0.364103 0.233731 -0.606159 0.625771 0.500425 0.551830 -1.250050
Kurtosis 3.607106 2.202114 1.891585 2.643173 2.585558 2.617344 2.551803 3.115367 5.150334
On the other hand, GDP at national level for Malaysia has been targeted
to grow 5-6% annually in the 11th Malaysia Plan 2016-2020 (EPU, 2015). Table
5 shows correlations analysis and the coefficients of Pearson Correlations
analysis result between both GDP Malaysia and Negeri Sembilan. Analysis
result shows the GDP Negeri Sembilan is moderately influencing the economy
of GDP Malaysia
390 | I S I W S C 2 0 1 9