
Page 402 - Contributed Paper Session (CPS) - Volume 7
P. 402
CPS2141 Lim Kok-Hwa et al.
Negeri Sembilan. Besides, further analysis has been done on the selected
significant factors and other additional indicators, which consist of consumer
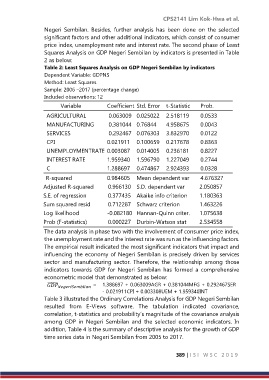
price index, unemployment rate and interest rate. The second phase of Least
Squares Analysis on GDP Negeri Sembilan by indicators is presented in Table
2 as below:
Table 2: Least Squares Analysis on GDP Negeri Sembilan by indicators
Dependent Variable: GDPNS
Method: Least Squares
Sample: 2006 –2017 (percentage change)
Included observations: 12
Variable Coefficient Std. Error t-Statistic Prob.
AGRICULTURAL 0.063009 0.025022 2.518119 0.0533
MANUFACTURING 0.381044 0.76844 4.958675 0.0043
SERVICES 0.292467 0.076303 3.832970 0.0122
CPI 0.021911 0.100659 0.217678 0.8363
UNEMPLOYMENTRATE 0.003087 0.014005 0.236181 0.8227
INTEREST RATE 1.959340 1.596790 1.227049 0.2744
C 1.288697 0.474867 2.924393 0.0328
R-squared 0.984605 Mean dependent var 4.676327
Adjusted R-squared 0.966130 S.D. dependent var 2.050857
S.E. of regression 0.377435 Akaike info criterion 1.180363
Sum squared resid 0.712287 Schwarz criterion 1.463226
Log likelihood -0.082180 Hannan-Quinn criter. 1.075638
Prob (F-statistics) 0.000227 Durbin-Watson stat 2.534558
The data analysis in phase two with the involvement of consumer price index,
the unemployment rate and the interest rate was run as the influencing factors.
The empirical result indicated the most significant indicators that impact and
influencing the economy of Negeri Sembilan is precisely driven by services
sector and manufacturing sector. Therefore, the relationship among those
indicators towards GDP for Negeri Sembilan has formed a comprehensive
econometric model that demonstrated as below:
̂ = 1.388697 + 0.063009AGR + 0.381044MFG + 0.292467SER
- 0.021911CPI + 0.003308UEM + 1.959340INT
Table 3 illustrated the Ordinary Correlations Analysis for GDP Negeri Sembilan
resulted from E-Views software. The tabulation indicated covariance,
correlation, t-statistics and probability’s magnitude of the covariance analysis
among GDP in Negeri Sembilan and the selected economic indicators. In
addition, Table 4 is the summary of descriptive analysis for the growth of GDP
time series data in Negeri Sembilan from 2005 to 2017.
389 | I S I W S C 2 0 1 9