
Page 86 - Contributed Paper Session (CPS) - Volume 7
P. 86
CPS2035 Noor Ismawati et al.
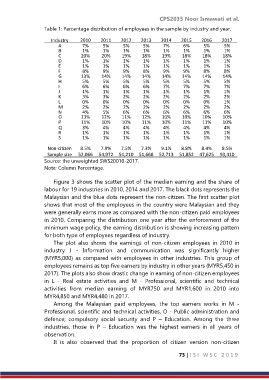
Table 1: Percentage distribution of employees in the sample by industry and year.
Industry 2010 2011 2012 2013 2014 2015 2016 2017
A 7% 5% 5% 5% 7% 6% 5% 5%
B 1% 1% 1% 1% 1% 1% 1% 1%
C 20% 20% 19% 18% 19% 18% 18% 18%
D 1% 1% 1% 1% 1% 1% 1% 1%
E 1% 1% 1% 1% 1% 1% 1% 1%
F 8% 9% 9% 8% 9% 9% 8% 8%
G 13% 14% 14% 14% 14% 14% 14% 14%
H 5% 5% 5% 5% 5% 5% 5% 5%
I 6% 6% 6% 6% 7% 7% 7% 7%
J 1% 1% 1% 1% 1% 1% 1% 1%
K 3% 3% 2% 2% 2% 2% 2% 2%
L 0% 0% 0% 0% 0% 0% 0% 1%
M 2% 2% 2% 2% 2% 2% 2% 2%
N 4% 5% 6% 6% 6% 6% 6% 6%
O 13% 12% 11% 12% 10% 10% 10% 10%
P 11% 10% 10% 11% 10% 11% 11% 10%
Q 3% 4% 4% 4% 4% 4% 4% 4%
R 1% 1% 1% 1% 1% 1% 1% 1%
S 1% 1% 1% 1% 1% 1% 1% 1%
Non-citizen 8.5% 7.9% 7.5% 7.3% 9.1% 8.8% 8.4% 8.5%
Sample size 52,066 54,972 54,210 51,668 52,713 51,852 47,625 93,410
Source: the unweighted SWS20010‐2017.
Note: Column Percentage.
Figure 3 shows the scatter plot of the median earning and the share of
labour for 19 industries in 2010, 2014 and 2017. The black dots represents the
Malaysian and the blue dots represent the non‐citizen. The first scatter plot
shows that most of the employees in the country were Malaysian and they
were generally earns more as compared with the non‐citizen paid employees
in 2010. Comparing the distribution one year after the enforcement of the
minimum wage policy, the earning distribution is showing increasing pattern
for both type of employees regardless of industry.
The plot also shows the earnings of non‐citizen employees in 2010 in
industry J ‐ Information and communication was significantly higher
(MYR5,000) as compared with employees in other industries. This group of
employees remains as top five earners by industry in other years (MYR5,450 in
2017). The plots also show drastic change in earning of non‐citizen employees
in L ‐ Real estate activities and M ‐ Professional, scientific and technical
activities from median earning of MYR750 and MYR1,600 in 2010 into
MYR4,850 and MYR4,480 in 2017.
Among the Malaysian paid employees, the top earners works in M ‐
Professional, scientific and technical activities, O ‐ Public administration and
defence; compulsory social security and P – Education. Among the three
industries, those in P – Education was the highest earners in all years of
observation.
It is also observed that the proportion of citizen version non‐citizen
73 | I S I W S C 2 0 1 9