
Page 101 - Contributed Paper Session (CPS) - Volume 6
P. 101
CPS1835 Lili Chen et al.
carbon emission intensity is to indicate the technical level (T), that is, the
carbon emissions per 1,000 US dollars of GDP. (5) The improvement of
urbanization level has promoted production and consumption levels,
resulting in an increase in carbon emissions. This paper selects the proportion
of population that aged 65 and over to indicate the level of urbanization. (6)
International trade is also one of the reasons for the increasing carbon
emissions. The selected proportion of total imports and exports of goods to
GDP in this paper indicates trade openness. The selected samples and data
descriptive statistics are shown in Table 1.
Table 1 Descriptive statistics of variables
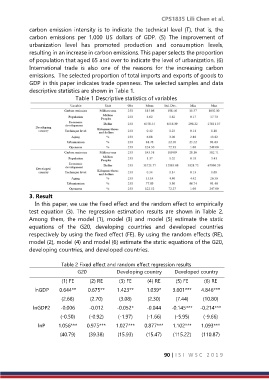
3. Result
In this paper, we use the fixed effect and the random effect to empirically
test equation (3). The regression estimation results are shown in Table 2.
Among them, the model (1), model (3) and model (5) estimate the static
equations of the G20, developing countries and developed countries
respectively by using the fixed effect (FE). By using the random effects (RE),
model (2), model (4) and model (6) estimate the static equations of the G20,
developing countries, and developed countries.
Table 2 Fixed effect and random effect regression results
G20 Developing country Developed country
(1) FE (2) RE (3) FE (4) RE (5) FE (6) RE
lnGDP 0.644** 0.675** 1.423** 1.039* 3.601*** 4.846***
(2.68) (2.70) (3.08) (2.30) (7.44) (10.80)
lnGDP2 -0.006 -0.012 -0.052* -0.044 -0.145*** -0.214***
(-0.50) (-0.92) (-1.97) (-1.66) (-5.95) (-9.66)
lnP 1.056*** 0.975*** 1.027*** 0.877*** 1.102*** 1.093***
(40.79) (39.38) (15.93) (15.47) (115.22) (110.87)
90 | I S I W S C 2 0 1 9