
Page 102 - Contributed Paper Session (CPS) - Volume 6
P. 102
CPS1835 Lili Chen et al.
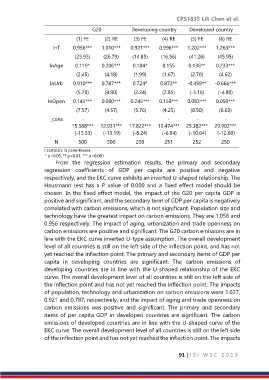
G20 Developing country Developed country
(1) FE (2) RE (3) FE (4) RE (5) FE (6) RE
lnT 0.956*** 1.010*** 0.921*** 0.996*** 1.202*** 1.263***
(25.95) (26.79) (14.85) (16.56) (41.28) (45.95)
lnAge 0.119* 0.206*** 0.184* 0.155 0.136** 0.233***
(2.45) (4.18) (1.99) (1.67) (2.70) (4.62)
lnUrb 0.910*** 0.787*** 0.724* 0.872** -0.459** -0.666***
(5.78) (4.90) (2.24) (2.85) (-3.16) (-4.88)
lnOpen 0.145*** 0.080*** 0.245*** 0.158*** 0.083*** 0.050***
(7.57) (4.57) (5.76) (4.25) (8.50) (6.63)
_cons - - - - - -
15.388*** 12.931*** 17.822*** 12.474*** 25.382*** 29.902***
(-15.53) (-13.19) (-8.24) (-6.64) (-10.64) (-12.60)
N 500 500 250 251 252 250
t statistics in parentheses
* p<0.05, ** p<0.01, *** p<0.001
From the regression estimation results, the primary and secondary
regression coefficients of GDP per capita are positive and negative
respectively, and the EKC curve exhibits an inverted U-shaped relationship. The
Hausmann test has a P value of 0.000 and a fixed effect model should be
chosen. In the fixed effect model, the impact of the G20 per capita GDP is
positive and significant, and the secondary term of GDP per capita is negatively
correlated with carbon emissions, which is not significant. Population size and
technology have the greatest impact on carbon emissions. They are 1.056 and
0.956 respectively. The impact of aging, urbanization and trade openness on
carbon emissions are positive and significant. The G20 carbon emissions are in
line with the EKC curve inverted U-type assumption. The overall development
level of all countries is still on the left side of the inflection point, and has not
yet reached the inflection point. The primary and secondary items of GDP per
capita in developing countries are significant. The carbon emissions of
developing countries are in line with the U-shaped relationship of the EKC
curve. The overall development level of all countries is still on the left side of
the inflection point and has not yet reached the inflection point. The impacts
of population, technology and urbanization on carbon emissions were 1.027,
0.921 and 0.787, respectively, and the impact of aging and trade openness on
carbon emissions was positive and significant. The primary and secondary
items of per capita GDP in developed countries are significant. The carbon
emissions of developed countries are in line with the U-shaped curve of the
EKC curve. The overall development level of all countries is still on the left side
of the inflection point and has not yet reached the inflection point. The impacts
91 | I S I W S C 2 0 1 9