
Page 103 - Contributed Paper Session (CPS) - Volume 6
P. 103
CPS1835 Lili Chen et al.
of population size and technology on carbon emissions were 1.102 and 1.202,
respectively. The impact of aging and trade openness on carbon emissions was
positive and significant, while the impact of urbanization on carbon emissions
was significantly negatively correlated.
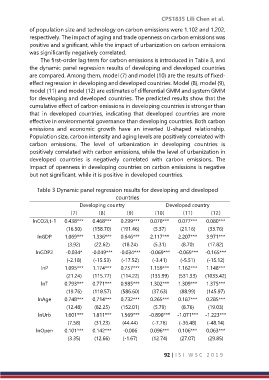
The first-order lag term for carbon emissions is introduced in Table 3, and
the dynamic panel regression results of developing and developed countries
are compared. Among them, model (7) and model (10) are the results of fixed-
effect regression in developing and developed countries. Model (8), model (9),
model (11) and model (12) are estimates of differential GMM and system GMM
for developing and developed countries. The predicted results show that the
cumulative effect of carbon emissions in developing countries is stronger than
that in developed countries, indicating that developed countries are more
effective in environmental governance than developing countries. Both carbon
emissions and economic growth have an inverted U-shaped relationship.
Population size, carbon intensity and aging levels are positively correlated with
carbon emissions. The level of urbanization in developing countries is
positively correlated with carbon emissions, while the level of urbanization in
developed countries is negatively correlated with carbon emissions. The
impact of openness in developing countries on carbon emissions is negative
but not significant, while it is positive in developed countries.
Table 3 Dynamic panel regression results for developing and developed
countries
Developing country Developed country
(7) (8) (9) (10) (11) (12)
lnCO2i,t-1 0.438*** 0.468*** 0.299*** 0.070*** 0.077*** 0.080***
(16.50) (158.70) (191.46) (5.37) (21.16) (33.76)
lnGDP 1.069*** 1.336*** 0.646*** 2.117*** 2.207*** 3.971***
(3.92) (22.62) (18.24) (5.31) (8.70) (17.82)
lnGDP2 -0.034* -0.049*** -0.034*** -0.069*** -0.069*** -0.165***
(-2.18) (-15.53) (-17.52) (-3.41) (-5.51) (-15.12)
lnP 1.095*** 1.174*** 0.757*** 1.159*** 1.162*** 1.148***
(21.24) (115.77) (114.22) (135.99) (531.33) (1033.42)
lnT 0.793*** 0.771*** 0.985*** 1.302*** 1.309*** 1.375***
(19.76) (118.57) (586.60) (37.63) (88.99) (145.97)
lnAge 0.748*** 0.714*** 0.732*** 0.265*** 0.187*** 0.285***
(12.48) (82.25) (152.01) (5.79) (8.76) (19.03)
lnUrb 1.601*** 1.811*** 1.569*** -0.890*** -1.071*** -1.223***
(7.58) (31.23) (44.44) (-7.76) (-36.48) (-48.14)
lnOpen 0.101*** 0.142*** -0.006 0.096*** 0.106*** 0.063***
(3.35) (12.66) (-1.67) (12.74) (27.07) (29.85)
92 | I S I W S C 2 0 1 9