
Page 109 - Contributed Paper Session (CPS) - Volume 6
P. 109
CPS1837 Qiguang Dong et al.
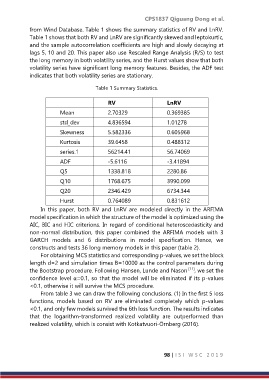
from Wind Database. Table 1 shows the summary statistics of RV and LnRV.
Table 1 shows that both RV and LnRV are significantly skewed and leptokurtic,
and the sample autocorrelation coefficients are high and slowly decaying at
lags 5, 10 and 20. This paper also use Rescaled Range Analysis (R/S) to test
the long memory in both volatility series, and the Hurst values show that both
volatility series have significant long memory features. Besides, the ADF test
indicates that both volatility series are stationary.
Table 1 Summary Statistics.
RV LnRV
Mean 2.70329 0.369385
std_dev 4.836594 1.01278
Skewness 5.582336 0.605968
Kurtosis 39.6458 0.488312
series.1 56214.41 56.74069
ADF -5.6116 -3.41894
Q5 1338.818 2280.86
Q10 1768.675 3990.099
Q20 2346.429 6734.344
Hurst 0.764089 0.831612
In this paper, both RV and LnRV are modeled directly in the ARFIMA
model specification in which the structure of the model is optimized using the
AIC, BIC and HIC criterions. In regard of conditional heteroscedasticity and
non-normal distribution, this paper combined the ARFIMA models with 3
GARCH models and 6 distributions in model specification. Hence, we
constructs and tests 36 long memory models in this paper (table 2).
For obtaining MCS statistics and corresponding p-values, we set the block
length d=2 and simulation times B=10000 as the control parameters during
the Bootstrap procedure. Following Hansen, Lunde and Nason [11] , we set the
confidence level α=0.1, so that the model will be eliminated if its p-values
<0.1, otherwise it will survive the MCS procedure.
From table 3 we can draw the following conclusions. (1) In the first 5 loss
functions, models based on RV are eliminated completely which p-values
<0.1, and only few models survived the 6th loss function. The results indicates
that the logarithm-transformed realized volatility are outperformed than
realized volatility, which is consist with Kotkatvuori-Örnberg (2016).
98 | I S I W S C 2 0 1 9