Page 108 - Contributed Paper Session (CPS) - Volume 6
P. 108

CPS1837 Qiguang Dong et al.
                                                     ∞     Γ( − ) 
                                              
                                        (1 − ) = ∑                                      (2)
                                                     =0 Γ(−)Γ( + 1)
                      ARFIMA models are strictly based on the assumptions of no conditional
                                                             [9]
                  heteroscedasticity  and  normal  distributions .  However,  current  literatures
                  show that the volatility  series violate both assumptions. Hence, this paper
                  considers these problems through two ways. Before the evaluation of models
                  predictive ability, this paper applies the out-of-sample rolling time window
                  forecasting.  After  then,  this  paper  compared  the  evaluated  volatility  with
                  realized  volatility  (in  this  paper  it  means  both  RV  and  LnRV)  through  loss
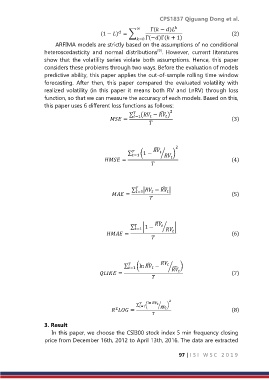
                  function, so that we can measure the accuracy of each models. Based on this,
                  this paper uses 6 different loss functions as follows:
                                                              ̂
                                                   ∑   ( −  ) 2
                                                                
                                                           
                                                    =1
                                            =                                       (3)
                                                          

                                                            ̂
                                                  ∑   (1 −   ⁄   ) 2
                                                    =1
                                          =                                     (4)


                                                               ̂
                                                    ∑   | −  |
                                                     =1
                                                                 
                                                           
                                             =                                      (5)
                                                          

                                                             ̂
                                                   ∑   |1 −   ⁄   |
                                                     =1
                                           =                                    (6)


                                                         ̂
                                                 ∑   (ln  −   ⁄ ̂  )
                                                  =1
                                                           
                                        =                                 (7)


                                                                  2
                                                     ∑   ( ln   ⁄ ̂  )
                                                      =1
                                             2
                                              =                             (8)
                                                            
                  3. Result
                     In this paper, we choose the CSI300 stock index 5 min frequency closing
                  price from December 16th, 2012 to April 13th, 2016. The data are extracted


                                                                      97 | I S I   W S C   2 0 1 9
   103   104   105   106   107   108   109   110   111   112   113