Page 170 - Contributed Paper Session (CPS) - Volume 6
P. 170

CPS1866 Milica Maricic et al.
                  suggested  an  eight-indicator  structure.  These  results  indicate  that  further
                  research on the SSI structure and its weighting scheme could be conducted.
                      The  next  steps  of  the  framework  methodology  which  should  be  more
                  closely observed are the aggregation and the weighting approach applied. In
                  the latest edition of the SSI geometric average was used as the aggregation
                  method, while the assigned weights were equal on each level. In our case
                  study, we will observe the hypothetical case when the aggregation method is
                  arithmetic. In such case, it would be valuable to explore the effective weight
                  of each indicator. Namely, the fact that equal weighting is used on each level
                  of the indicator does not imply that all indicators have the same importance
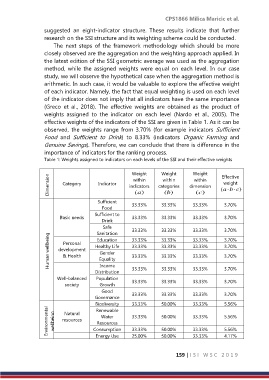
                  (Greco  et  al.,  2018).  The  effective  weights  are  obtained  as  the  product  of
                  weights  assigned  to  the  indicator  on  each  level  (Nardo  et  al.,  2005).  The
                  effective weights of the indicators of the SSI are given in Table 1. As it can be
                  observed,  the  weights  range  from  3.70%  (for  example  indicators  Sufficient
                  Food  and  Sufficient  to  Drink)  to  8.33%  (indicators  Organic  Farming  and
                  Genuine Savings). Therefore, we can conclude that there is difference in the
                  importance of indicators for the ranking process.
                  Table 1: Weights assigned to indicators on each levels of the SSI and their effective weights


                                                                           Weight
                                                               Weight
                                                    Weight
                    Dimension   Category   Indicator   indicators   categories   dimension   (a b c    )
                                                                                      Effective
                                                                           within
                                                    within
                                                               within
                                                                                       weight
                                                     ( )
                                                                ( )
                                                                            ( )
                                                      a
                                                                 b
                                                                             c
                                      Sufficient    33.33%     33.33%      33.33%      3.70%
                                        Food
                                     Sufficient to
                        Basic needs                 33.33%     33.33%      33.33%      3.70%
                                        Drink
                                        Safe        33.33%     33.33%      33.33%      3.70%
                                      Sanitation
                    Human wellbeing   development   Healthy Life   33.33%   33.33%   33.33%   3.70%
                                      Education
                         Personal
                                                    33.33%
                                                               33.33%
                                                                                       3.70%
                                                                           33.33%
                                       Gender
                                                                           33.33%
                         & Health
                                                    33.33%
                                                               33.33%
                                                                                       3.70%
                                       Equality
                                       Income
                                      Distribution   33.33%    33.33%      33.33%      3.70%
                       Well-balanced   Population   33.33%     33.33%      33.33%      3.70%
                          society      Growth
                                        Good
                                     Governance     33.33%     33.33%      33.33%      3.70%
                                      Biodiversity   33.33%    50.00%      33.33%      5.56%
                   Environmental   wellbeing   resources   Consumption   33.33%   50.00%   33.33%   5.56%
                                      Renewable
                          Natural
                                        Water
                                      Resources
                                                    33.33%
                                                               50.00%
                                                                                       5.56%
                                                                           33.33%
                                                                                       4.17%
                                                    25.00%
                                      Energy Use
                                                                           33.33%
                                                               50.00%
                                                                     159 | I S I   W S C   2 0 1 9
   165   166   167   168   169   170   171   172   173   174   175