
Page 173 - Contributed Paper Session (CPS) - Volume 6
P. 173
CPS1866 Milica Maricic et al.
weights (e.g. Genuine Savings from 8.33% to 2.2%). Importantly, the approach
suggested to exclude two indicators: Renewable Water Resources and
Employment. The provided results show that the framework of the SSI can be
simplified. The exclusion of these two indicators can be interpreted two-ways.
First, that the remaining indicators completely cover the information provided
by the two which are therefore redundant, and second, that the two indicators
decrease the stability of the SSI.
The exclusion of the two indicators is a notable result, as the algorithm
could have excluded all three indicators whose lower bound was 0. Namely,
Public Debt was given the weight 2.2% when it could have been given weight
0. The stability of the SSI is also improved. If the official weighting scheme is
used the sum of standard deviations of relative contributions is 0.34210233
while when the optimized weighting scheme is used it is 0.259332032.
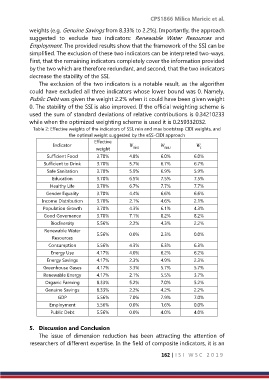
Table 2: Effective weights of the indicators of SSI, min and max bootstrap CIDI weights, and
the optimal weight suggested by the eSS-CIDI approach
Effective
Indicator w w w
weight mini maxi i
Sufficient Food 3.70% 4.8% 6.0% 6.0%
Sufficient to Drink 3.70% 5.7% 6.7% 6.7%
Safe Sanitation 3.70% 5.9% 6.9% 5.9%
Education 3.70% 6.5% 7.5% 7.5%
Healthy Life 3.70% 6.7% 7.7% 7.7%
Gender Equality 3.70% 4.4% 6.6% 6.6%
Income Distribution 3.70% 2.1% 4.6% 2.1%
Population Growth 3.70% 4.3% 6.1% 4.3%
Good Governance 3.70% 7.1% 8.2% 8.2%
Biodiversity 5.56% 2.2% 4.3% 2.2%
Renewable Water 5.56% 0.0% 2.3% 0.0%
Resources
Consumption 5.56% 4.3% 6.3% 6.3%
Energy Use 4.17% 4.0% 6.2% 6.2%
Energy Savings 4.17% 2.3% 4.9% 2.3%
Greenhouse Gases 4.17% 3.3% 5.7% 5.7%
Renewable Energy 4.17% 2.1% 5.5% 3.7%
Organic Farming 8.33% 5.2% 7.0% 5.2%
Genuine Savings 8.33% 2.2% 4.2% 2.2%
GDP 5.56% 7.0% 7.9% 7.0%
Employment 5.56% 0.0% 1.6% 0.0%
Public Debt 5.56% 0.0% 4.0% 4.0%
5. Discussion and Conclusion
The issue of dimension reduction has been attracting the attention of
researchers of different expertise. In the field of composite indicators, it is an
162 | I S I W S C 2 0 1 9