
Page 180 - Contributed Paper Session (CPS) - Volume 6
P. 180
CPS1867 Winita S. et al.
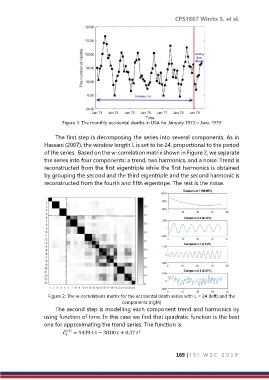
Figure 1: The monthly accidental deaths in USA for January 1973 – June 1979
The first step is decomposing the series into several components. As in
Hassani (2007), the window length L is set to be 24, proportional to the period
of the series. Based on the w-correlation matrix shown in Figure 2, we separate
the series into four components: a trend, two harmonics, and a noise. Trend is
reconstructed from the first eigentriple while the first harmonics is obtained
by grouping the second and the third eigentriple and the second harmonic is
reconstructed from the fourth and fifth eigentripe. The rest is the noise.
Figure 2: The w-correlations matrix for the accidental death series with L = 24 (left) and the
components (right)
The second step is modelling each component trend and harmonics by
using function of time. In this case we find that quadratic function is the best
one for approximating the trend series. The function is
169 | I S I W S C 2 0 1 9