
Page 324 - Contributed Paper Session (CPS) - Volume 6
P. 324
CPS1942 Daniel D. M. P.
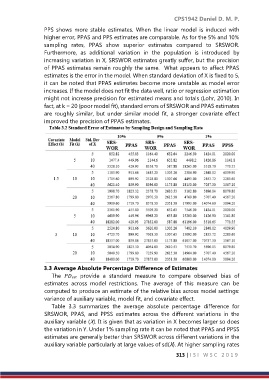
PPS shows more stable estimates. When the linear model is induced with
higher error, PPAS and PPS estimates are comparable. As for the 5% and 10%
sampling rates, PPAS show superior estimates compared to SRSWOR.
Furthermore, as additional variation in the population is introduced by
increasing variation in X, SRSWOR estimates greatly suffer, but the precision
of PPAS estimates remain roughly the same. What appears to affect PPAS
estimates is the error in the model. When standard deviation of X is fixed to 5,
it can be noted that PPAS estimates become more unstable as model error
increases. If the model does not fit the data well, ratio or regression estimation
might not increase precision for estimated means and totals (Lohr, 2010). In
fact, at k = 20 (poor model fit), standard errors of SRSWOR and PPAS estimates
are roughly similar, but under similar model fit, a stronger covariate effect
improved the precision of PPAS estimates.
3.3 Average Absolute Percentage Difference of Estimates
The provide a standard measure to compare observed bias of
estimates across model restrictions. The average of this measure can be
computed to produce an estimate of the relative bias across model settings:
variance of auxiliary variable, model fit, and covariate effect.
Table 3.3 summarizes the average absolute percentage difference for
SRSWOR, PPAS, and PPSS estimates across the different variations in the
auxiliary variable (X). It is given that as variation in X becomes larger so does
the variation in Y. Under 1% sampling rate it can be noted that PPAS and PPSS
estimates are generally better than SRSWOR across different variations in the
auxiliary variable particularly at large values of sd(X). At higher sampling rates
313 | I S I W S C 2 0 1 9