
Page 322 - Contributed Paper Session (CPS) - Volume 6
P. 322
CPS1942 Daniel D. M. P.
Aggregate Size Sampling (PPAS) in estimating the population total as
compared to the designunbiased estimation using Simple Random Sampling
Without Replacement (SRSWOR) and Probability Proportional to Size:
Systematic (PPSS).
This study aims to identify the population characteristics where optimality
of estimates is achieved using PPAS as compared to SRSWOR and PPSS. Data
sets were simulated to explore on the different behaviours of the population
of interest. Comparison of estimates were made by comparing bias and
precision of estimates. Variance estimation is done with nonparametric
bootstrap to address the issue of negative estimated variance.
2. Methodology
2.1 Simulation Study
To evaluate the performance of PPAS estimates under varying conditions,
a simulation study was conducted. Each scenario postulates a linear model:
= + , ~ (0,1)
For this equation, the following quantities are made to vary: covariate effect
(b), standard deviation of the auxiliary variable (sd(X)), multiplier (k) on the
error term, and sampling rate. These variations aim to capture the different
patterns of linear association between the target and auxiliary variable.
The covariate effect (b) are set to two values: 1.5 and 5 to reflect low and high
covariate effect. The auxiliary variable X is randomly generated from a normal
distribution with mean 50 and standard deviations 5, 10, and 40. Error terms
are generated from the standard normal distribution with multipliers (k) set to
5, 10, 20. These values induce varying strengths of linear association between
X and Y. A similar approach was used by Barrios & Kwong (2010) in simulating
the different model fit for linear and nonlinear relationships between the target
and auxiliary variable to capture to strong, average, and weak linear
relationships, respectively. Also, as (k) increases, the model fit suffers because
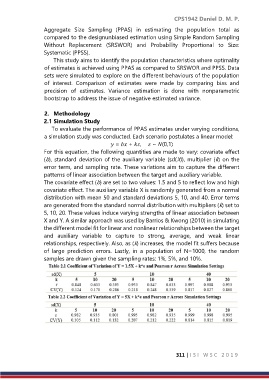
of large prediction errors. Lastly, in a population of N=1000, the random
samples are drawn given the sampling rates: 1%, 5%, and 10%.
311 | I S I W S C 2 0 1 9