Page 418 - Contributed Paper Session (CPS) - Volume 6
P. 418

CPS2007 Jai-Hua Yen et al.
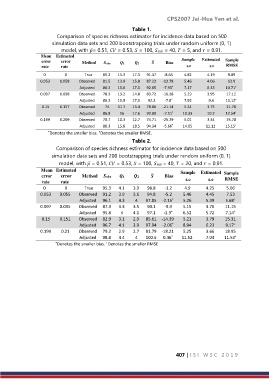
                                                    Table 1.
                       Comparison of species richness estimator for incidence data based on 500
                     simulation data sets and 200 bootstrapping trials under random uniform (0, 1)
                         model, with ̅= 0.51,  = 0.53,  = 100,  = 40,  = 5, and  = 0.91.
                 Mean  Estimated
                 error   error   Method                 ̂     Bias    Sample    Estimated   Sample
                 rate    rate                                            s.e     s.e    RMSE
                  0       0       True    85.2    15.3    17.3    91.37    -8.63    4.82    4.19    9.89
                 0.053    0.058    Observed    81.5    13.9    15.8    87.22    -12.78     5.46    4.06    13.9
                                                                                           †
                                                                   *
                                Adjusted    86.3    15.6    17.5    92.05    -7.95     7.17    8.33    10.71
                 0.097    0.098    Observed    78.3    13.2    14.8    83.72    -16.28     5.29    3.95    17.12
                                                                   *
                                Adjusted    86.3    15.9    17.5    92.2    -7.8     7.92    9.4    11.12
                                                                                           †
                 0.15    0.157    Observed    74    11.7    13.4    78.86    -21.14     5.24    3.75    21.78
                                                                                           †
                                                                   *
                                Adjusted    86.8    16    17.6    92.89    -7.11     10.33    10.2    12.54
                 0.199    0.209    Observed    70.7    10.3    12.7    74.71    -25.29    5.01    3.34    25.78
                                                                   *
                                Adjusted    88.3    15.8    18.5    94.34    -5.66     14.05    11.12    15.15
                                                                                           †
                                       †
                   * Denotes the smaller bias.  Denotes the smaller RMSE.
                                                    Table 2.
                       Comparison of species richness estimator for incidence data based on 500
                     simulation data sets and 200 bootstrapping trials under random uniform (0, 1)
                        model, with ̅ = 0.51,  = 0.53,  = 100,  = 40,  = 20, and  = 0.91.
                 Mean  Estimated
                 error   error   Method                ̂      Bias    Sample   Estimated   Sample
                                                                        s.e      s.e    RMSE
                 rate    rate
                  0       0      True    95.3    4.1    3.9    98.8    -1.2    4.9    4.25    5.06
                 0.053    0.055    Observed   91.2    3.9    3.6    94.8    -5.2    5.46    4.45    7.53
                                Adjusted   96.1    4.3    4    97.85   -2.15     5.26    5.39    5.68
                                                                                           †
                                                                   *
                 0.097    0.095    Observed   87.3    3.3    3.5    90.1    -9.9    5.15    3.76    11.15
                                                                   *
                                Adjusted   95.8    4    4.1    97.1    -2.9     6.52    5.72    7.14
                                                                                           †
                 0.15    0.151    Observed   82.9    3.1    2.9   85.61   -14.39    5.21    3.79    15.31
                                                                   *
                                                                                           †
                                Adjusted   96.7    4.1    3.9   97.94   -2.06     8.94    6.23    9.17
                 0.199    0.21    Observed   79.2    2.9    2.7   81.79   -18.21    5.25    3.66    18.95
                                Adjusted   98.8    4.4    4    100.5   0.46     11.52    7.04    11.53
                                                                                           †
                                                                   *
                      * Denotes the smaller bias.  Denotes the smaller RMSE
                                          †


                                                                     407 | I S I   W S C   2 0 1 9
   413   414   415   416   417   418   419   420   421   422   423