Page 419 - Contributed Paper Session (CPS) - Volume 6
P. 419

CPS2007 Jai-Hua Yen et al.
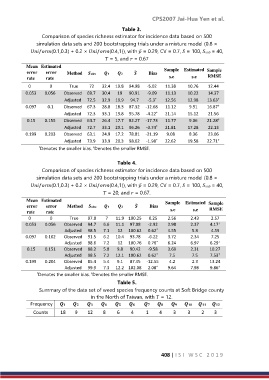
                                                Table 3.
                 Comparison of species richness estimator for incidence data based on 500
               simulation data sets and 200 bootstrapping trials under a mixture model (0.8 ×
             (0.1,0.3) + 0.2 × (0.4,1)), with ̅ = 0.29, CV = 0.7,  = 100,  = 40,
                                          = 5, and  = 0.67
           Mean  Estimated
           error   error   Method                ̂       Bias    Sample   Estimated   Sample
           rate    rate                                           s.e      s.e    RMSE
            0       0       True    72    32.4   19.8   94.98    -5.02    11.38    10.76    12.44
           0.053    0.056    Observed   69.7   30.4    19   90.91    -9.09     11.13    10.22    14.37
                                                                                     †
                                                             *
                          Adjusted   72.5   32.9   19.9   94.7    -5.3     12.56    12.98    13.63
                                                                                     †
           0.097    0.1    Observed   67.3   28.8   18.3   87.32   -12.68    11.12    9.91    16.87
                          Adjusted   72.3   33.1   19.8   95.78   -4.22     21.14    15.12    21.56
                                                             *
                                                                                     †
           0.15    0.155    Observed   64.7   26.4   17.7   82.27   -17.73     11.77    9.06    21.28
                          Adjusted   72.7   33.1   20.1   96.26   -3.74     21.81    17.28    22.13
                                                             *
           0.199    0.203    Observed   63.1   24.9   17.2   78.81   -21.19     9.08    8.36    23.06
                                                             *
                                                                                     †
                          Adjusted   73.9   33.9   20.3   98.02   -1.98     22.62    19.58    22.71
                * Denotes the smaller bias.  Denotes the smaller RMSE.
                                     †

                                              Table 4.
                 Comparison of species richness estimator for incidence data based on 500
               simulation data sets and 200 bootstrapping trials under a mixture model (0.8 ×
             (0.1,0.3) + 0.2 × (0.4,1)), with ̅ = 0.29, CV = 0.7,  = 100,  = 40,
                                          = 20, and  = 0.67.
           Mean  Estimated
           error   error   Method                ̂     Bias    Sample   Estimated   Sample
                                                                  s.e      s.e    RMSE
           rate    rate
            0       0       True    97.8    7    11.9   100.25    0.25    2.56    2.43    2.57
           0.053    0.056    Observed   94.7    6.6   11.1   97.08    -2.92    2.98    2.37    4.17
                                                                                     †
                                                             *
                          Adjusted   98.5    7.1    12   100.62   0.62     4.55    5.8    4.59
           0.097    0.102    Observed   91.5    6.2   10.4   93.78    -6.22    3.72    2.34    7.25
                                                             *
                                                                                     †
                          Adjusted   98.6    7.2    12   100.76   0.76     6.24    6.97    6.29
           0.15    0.151    Observed   88.2    5.8    9.8    90.42    -9.58    3.69    2.31    10.27
                                                                                     †
                                                             *
                          Adjusted   98.5    7.2   12.1   100.62   0.62     7.5    7.5    7.53
           0.199    0.204    Observed   85.4    5.4    9.1    87.45   -12.55    4.2    2.3    13.24
                          Adjusted   99.9    7.3   12.2   102.08   2.08     9.64    7.98    9.86
                                                                                     †
                                                             *
               * Denotes the smaller bias.  Denotes the smaller RMSE.
                                    †
                                              Table 5.
                Summary of the data set of weed species frequency counts at Soft Bridge county
                                    in the North of Taiwan, with  = 12.
             Frequency                                          
              Counts    18    9    12    8    6    4     1    4    3     3    2    3


                                                               408 | I S I   W S C   2 0 1 9
   414   415   416   417   418   419   420   421   422   423   424