
Page 101 - Invited Paper Session (IPS) - Volume 1
P. 101
IPS102 Arjan B.
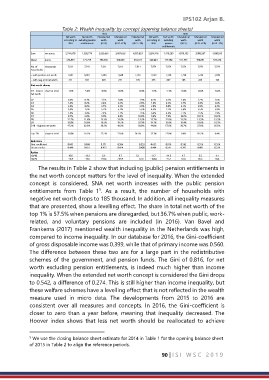
Table 2: Wealth inequality by concept (opening balance sheets)
2015 2016
Net worth Net worth Extended net Extended net Extended net Net worth Net worth Extended net Extended net Extended net
according to excluding pension worth worth worth according to excluding worth worth worth
SNA entitlements (IRTS) (IRTS +1%) (IRTS -1%) SNA pension (IRTS) (IRTS +1%) (IRTS -1%)
entitlements
Sum mn euros 2,744,070 1,358,779 3,839,863 3,687,038 4,035,833 2,894,916 1,419,289 4,079,353 3,908,207 4,300,943
Mean euros 346,849 171,749 485,356 466,039 510,127 363,024 177,980 511,553 490,091 539,340
No. of thousands 7,911 7,911 7,911 7,911 7,911 7,974 7,974 7,974 7,974 7,974
households
... with positive net worth 7,501 6,981 7,683 7,640 7,733 7,599 7,138 7,790 7,746 7,839
... with neg or 0 net worth 411 931 229 271 178 375 837 185 229 135
Net worth shares
D1 - lowest share in total -1.6% -5.6% -0.6% -0.8% -0.4% -1.3% -5.1% -0.4% -0.6% -0.2%
net worth
D2 0.6% 0.1% 1.1% 1.0% 1.3% 0.7% 0.1% 1.4% 1.2% 1.6%
D3 1.4% 0.2% 2.4% 2.2% 2.6% 1.6% 0.3% 2.7% 2.6% 3.0%
D4 2.4% 0.6% 3.7% 3.5% 3.9% 2.8% 0.8% 4.1% 3.9% 4.3%
D5 3.8% 1.5% 5.2% 5.1% 5.5% 4.3% 2.1% 5.6% 5.5% 5.9%
D6 5.9% 3.4% 7.3% 7.1% 7.5% 6.4% 4.3% 7.7% 7.5% 7.9%
D7 8.7% 6.8% 9.9% 9.8% 10.0% 9.3% 7.9% 10.2% 10.1% 10.3%
D8 12.7% 11.6% 13.3% 13.3% 13.3% 13.1% 12.6% 13.5% 13.5% 13.5%
D9 19.0% 18.6% 18.5% 18.7% 18.3% 19.1% 19.6% 18.4% 18.6% 18.2%
D10 - highest net worth 47.2% 62.9% 39.2% 40.2% 38.0% 44.0% 57.5% 36.7% 37.6% 35.5%
Top 1% share in total 15.0% 26.2% 11.2% 11.6% 10.7% 13.1% 21.8% 9.8% 10.2% 9.4%
Indicators
Gini-co efficient 0.665 0.860 0.571 0.584 0.553 0.635 0.816 0.542 0.556 0.524
Hoover index 0.488 0.631 0.413 0.424 0.400 0.464 0.597 0.392 0.402 0.378
Ratios
10/40 16.6 -13.3 5.9 6.7 5.1 11.7 -14.5 4.7 5.3 4.1
20/20 -70.9 -14.6 110.6 249.9 62.4 -104.0 -15.2 56.8 86.5 38.4
The results in Table 2 show that including (public) pension entitlements in
the net worth concept matters for the level of inequality. When the extended
concept is considered, SNA net worth increases with the public pension
5
entitlements from Table 1 . As a result, the number of households with
negative net worth drops to 185 thousand. In addition, all inequality measures
that are presented, show a levelling effect. The share in total net worth of the
top 1% is 57.5% when pensions are disregarded, but 36.7% when public, work-
related, and voluntary pensions are included (in 2016). Van Bavel and
Frankema (2017) mentioned wealth inequality in the Netherlands was high,
compared to income inequality. In our database for 2016, the Gini-coefficient
of gross disposable income was 0.399, while that of primary income was 0.560.
The difference between these two are for a large part in the redistributive
schemes of the government, and pension funds. The Gini of 0.816, for net
worth excluding pension entitlements, is indeed much higher than income
inequality. When the extended net worth concept is considered the Gini drops
to 0.542, a difference of 0.274. This is still higher than income inequality, but
these welfare schemes have a levelling effect that is not reflected in the wealth
measure used in micro data. The developments from 2015 to 2016 are
consistent over all measures and concepts. In 2016, the Gini-coefficient is
closer to zero than a year before, meaning that inequality decreased. The
Hoover index shows that less net worth should be reallocated to achieve
5 We use the closing balance sheet estimate for 2014 in Table 1 for the opening balance sheet
of 2015 in Table 2 to align the reference periods.
90 | I S I W S C 2 0 1 9