
Page 102 - Invited Paper Session (IPS) - Volume 1
P. 102
IPS102 Arjan B.
equality, and the income shares of the top 1 and top 10% decrease, where
those of the bottom 10% improve.
While in income inequality studies it is common to account for economies
of scale, because households differ in size and composition, this is less often
done so in studies on wealth inequality. An important reason for this is that
there is no information about when this wealth will be used, and by who.
Income is used in the reference period it concerns, but wealth is postponed
consumption, and can even be bequeathed to future generations (Sierminska
& Smeeding, 2005).
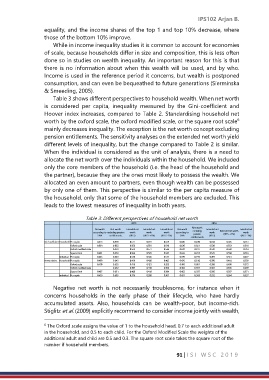
Table 3 shows different perspectives to household wealth. When net worth
is considered per capita, inequality measured by the Gini-coefficient and
Hoover index increases, compared to Table 2. Standardising household net
6
worth by the oxford scale, the oxford modified scale, or the square root scale
mainly decreases inequality. The exception is the net worth concept excluding
pension entitlements. The sensitivity analyses on the extended net worth yield
different levels of inequality, but the change compared to Table 2 is similar.
When the individual is considered as the unit of analysis, there is a need to
allocate the net worth over the individuals within the household. We included
only the core members of the household (i.e. the head of the household and
the partner), because they are the ones most likely to possess the wealth. We
allocated an even amount to partners, even though wealth can be possessed
by only one of them. This perspective is similar to the per capita measure of
the household, only that some of the household members are excluded. This
leads to the lowest measures of inequality in both years.
Table 3: Different perspectives of household net worth
2015 2016
Net worth
Net worth Net worth Extended net Extended net Extended net Net worth Extended net Extended net
according to excluding pension worth worth worth according to excluding worth Extended net worth worth
(IRTS +1%)
pension
SNA entitlements (IRTS) (IRTS +1%) (IRTS -1%) SNA (IRTS) (IRTS -1%)
entitlements
Gini-coefficient Household Per capita 0.673 0.869 0.577 0.591 0.559 0.646 0.830 0.550 0.565 0.531
Oxford scale 0.664 0.862 0.566 0.581 0.548 0.636 0.821 0.538 0.553 0.518
Oxford modified scale 0.859 0.563 0.577 0.544 0.631 0.817 0.533 0.549 0.514
Square Root 0.661 0.858 0.564 0.578 0.545 0.632 0.815 0.535 0.550 0.516
Individual Per capita 0.633 0.838 0.530 0.545 0.511 0.599 0.793 0.497 0.513 0.477
Hoover index Household Per capita 0.499 0.643 0.419 0.430 0.405 0.476 0.610 0.398 0.410 0.383
Oxford scale 0.490 0.635 0.410 0.421 0.395 0.466 0.601 0.388 0.400 0.373
Oxford modified scale 0.632 0.407 0.418 0.392 0.462 0.597 0.384 0.396 0.369
Square Root 0.487 0.631 0.408 0.419 0.394 0.462 0.597 0.386 0.397 0.371
Individual Per capita 0.458 0.605 0.376 0.388 0.361 0.431 0.569 0.352 0.364 0.337
Negative net worth is not necessarily troublesome, for instance when it
concerns households in the early phase of their lifecycle, who have hardly
accumulated assets. Also, households can be wealth-poor, but income-rich.
Stiglitz et al. (2009) explicitly recommend to consider income jointly with wealth,
6 The Oxford scale assigns the value of 1 to the household head, 0.7 to each additional adult
in the household, and 0.5 to each child. For the Oxford Modified Scale the weights of the
additional adult and child are 0.5 and 0.3. The square root scale takes the square root of the
number if household members.
91 | I S I W S C 2 0 1 9