
Page 109 - Invited Paper Session (IPS) - Volume 1
P. 109
IPS102 Sigita G. et al.
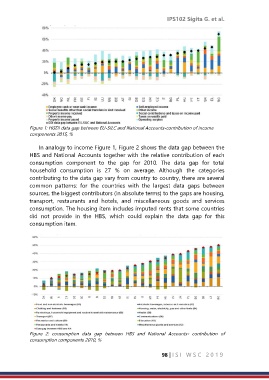
Figure 1: HGDI data gap between EU-SILC and National Accounts-contribution of income
components 2015, %
In analogy to income Figure 1, Figure 2 shows the data gap between the
HBS and National Accounts together with the relative contribution of each
consumption component to the gap for 2010. The data gap for total
household consumption is 27 % on average. Although the categories
contributing to the data gap vary from country to country, there are several
common patterns: for the countries with the largest data gaps between
sources, the biggest contributors (in absolute terms) to the gaps are housing,
transport, restaurants and hotels, and miscellaneous goods and services
consumption. The housing item includes imputed rents that some countries
did not provide in the HBS, which could explain the data gap for this
consumption item.
Figure 2: consumption data gap between HBS and National Accounts- contribution of
consumption components 2010, %
98 | I S I W S C 2 0 1 9