
Page 110 - Invited Paper Session (IPS) - Volume 1
P. 110
IPS102 Sigita G. et al.
In order to allocate the data gaps for total income several data allocation
methods are explored:
1) Proportional allocation of the data gaps (this test is done for each
income component and for total income);
2) Minimising and maximising inequality – allocation of the data gap to
the first and fifth quintile, to see the impact of the data allocation
method;
3) Parametric data allocation method – modelling the Pareto tail: the data
gap is allocated in the top 5% according to the Pareto distribution.
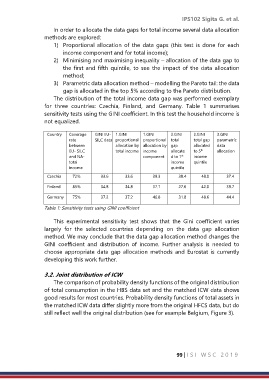
The distribution of the total income data gap was performed exemplary
for three countries: Czechia, Finland, and Germany. Table 1 summarises
sensitivity tests using the GINI coefficient. In this test the household income is
not equalized.
Country Coverage GINI EU- 1.GINI 1.GINI 2.GINI 2.GINI 3.GINI
rate SILC data proportional proportional total total gap parametric
between allocation by allocation by gap allocated data
th
EU- SILC total income income allocate to 5 allocation
st
and NA- component d to 1 income
total income quintile
income quintile
Czechia 72% 33.6 33.6 39.3 30.4 48.0 37.4
Finland 85% 34.8 34.8 37.1 27.6 42.0 39.7
Germany 75% 37.2 37.2 46.8 31.8 48.6 44.4
Table 1: Sensitivity tests using GINI coefficient
This experimental sensitivity test shows that the Gini coefficient varies
largely for the selected countries depending on the data gap allocation
method. We may conclude that the data gap allocation method changes the
GINI coefficient and distribution of income. Further analysis is needed to
choose appropriate data gap allocation methods and Eurostat is currently
developing this work further.
3.2. Joint distribution of ICW
The comparison of probability density functions of the original distribution
of total consumption in the HBS data set and the matched ICW data shows
good results for most countries. Probability density functions of total assets in
the matched ICW data differ slightly more from the original HFCS data, but do
still reflect well the original distribution (see for example Belgium, Figure 3).
99 | I S I W S C 2 0 1 9