
Page 112 - Invited Paper Session (IPS) - Volume 1
P. 112
IPS102 Sigita G. et al.
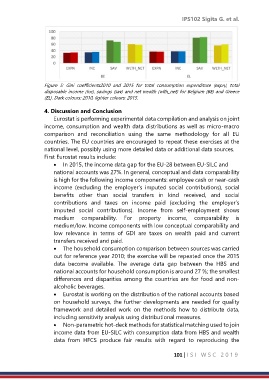
Figure 5: Gini coefficients2010 and 2015 for total consumption expenditure (expn), total
disposable income (inc), savings (sav) and net wealth (wlth_net) for Belgium (BE) and Greece
(EL). Dark colours: 2010, lighter colours: 2015.
4. Discussion and Conclusion
Eurostat is performing experimental data compilation and analysis on joint
income, consumption and wealth data distributions as well as micro-macro
comparison and reconciliation using the same methodology for all EU
countries. The EU countries are encouraged to repeat these exercises at the
national level, possibly using more detailed data or additional data sources.
First Eurostat results include:
• In 2015, the income data gap for the EU-28 between EU-SILC and
national accounts was 27%. In general, conceptual and data comparability
is high for the following income components: employee cash or near-cash
income (excluding the employer’s imputed social contributions), social
benefits other than social transfers in kind received, and social
contributions and taxes on income paid (excluding the employer’s
imputed social contributions). Income from self-employment shows
medium comparability. For property income, comparability is
medium/low. Income components with low conceptual comparability and
low relevance in terms of GDI are taxes on wealth paid and current
transfers received and paid.
• The household consumption comparison between sources was carried
out for reference year 2010; the exercise will be repeated once the 2015
data become available. The average data gap between the HBS and
national accounts for household consumption is around 27 %; the smallest
differences and disparities among the countries are for food and non-
alcoholic beverages.
• Eurostat is working on the distribution of the national accounts based
on household surveys, the further developments are needed for quality
framework and detailed work on the methods how to distribute data,
including sensitivity analysis using distributional measures.
• Non-parametric hot-deck methods for statistical matching used to join
income data from EU-SILC with consumption data from HBS and wealth
data from HFCS produce fair results with regard to reproducing the
101 | I S I W S C 2 0 1 9