
Page 111 - Invited Paper Session (IPS) - Volume 1
P. 111
IPS102 Sigita G. et al.
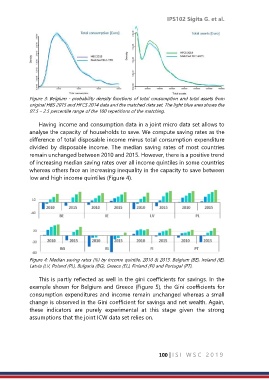
Figure 3: Belgium - probability density functions of total consumption and total assets from
original HBS 2015 and HFCS 2014 data and the matched data set. The light blue area shows the
97.5 – 2.5 percentile range of the 100 repetitions of the matching.
Having income and consumption data in a joint micro data set allows to
analyse the capacity of households to save. We compute saving rates as the
difference of total disposable income minus total consumption expenditure
divided by disposable income. The median saving rates of most countries
remain unchanged between 2010 and 2015. However, there is a positive trend
of increasing median saving rates over all income quintiles in some countries
whereas others face an increasing inequality in the capacity to save between
low and high income quintiles (Figure 4).
Figure 4: Median saving rates (%) by income quintile, 2010 & 2015. Belgium (BE), Ireland (IE),
Latvia (LV, Poland (PL), Bulgaria (BG), Greece (EL), Finland (FI) and Portugal (PT).
This is partly reflected as well in the gini coefficients for savings. In the
example shown for Belgium and Greece (Figure 5), the Gini coefficients for
consumption expenditures and income remain unchanged whereas a small
change is observed in the Gini coefficient for savings and net wealth. Again,
these indicators are purely experimental at this stage given the strong
assumptions that the joint ICW data set relies on.
100 | I S I W S C 2 0 1 9