
Page 123 - Invited Paper Session (IPS) - Volume 2
P. 123
IPS 188 G. P. Samanta
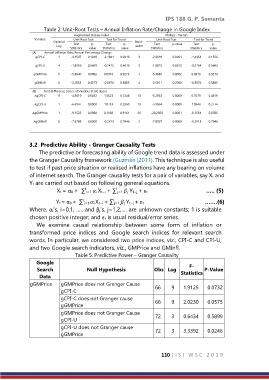
Table 2: Unit-Root Tests – Annual Inflation Rate/Change in Google Index
Augmented Dickey-Fuller Phillips - Perron
Variable Unit-Root Test Test for Trend Unit-Root Test Test for Trend
Optimal Test p- Test p- Band- Test p-value Test p-
Lag width
Statistics value Statistics value Statistics Statistics value
(A) Annual Inflation Rate/Annual Percentage Change
gCPI-C 1 -3.1547 0.1018 -2.1941 0.0316 3 -2.3619 0.3961 -1.4354 0.1556
gCPI-U 4 -1.8559 0.6669 -0.7415 0.4610 5 -1.8075 0.6912 -0.5764 0.5662
gGMPrice 0 -5.3040 0.0002 0.0916 0.9273 1 -5.3040 0.0002 0.0916 0.9273
gGMInfl 0 -2.2835 0.4373 -0.8676 0.3885 4 -2.5811 0.2900 -0.8676 0.3885
(B) First-Difference Series of Variable at (A) above
∆gCPI-C 11 -4.3419 0.0052 1.5623 0.1248 13 -6.2063 0.0000 0.7070 0.4819
∆gCPI-U 1 -6.6947 0.0000 1.0733 0.2869 13 -5.9064 0.0000 1.0946 0.2774
∆gGMPrice 1 -9.1522 0.0000 0.1058 0.9161 26 -20.2929 0.0001 -0.1534 0.8785
∆gGMInfl 0 -7.8708 0.0000 -0.2613 0.7946 2 -7.8397 0.0000 -0.2613 0.7946
3.2 Predictive Ability - Granger Causality Tests
The predictive or forecasting ability of Google trend data is assessed under
the Granger Causality framework (Guzmán (2011). This technique is also useful
to test if past price situation or realised inflations have any bearing on volume
of internet search. The Granger causality tests for a pair of variables, say Xt and
Yt are carried out based on following general equations.
l
Xt = α0 + ∑ i=1 i Xt−i + ∑ j=1 Yt−j + εt ….. (5)
l
l
Yt = α0 + ∑ i=1 i Xt−i + ∑ j=1 Yt−j + εt …….(6)
l
Where, αi’s, i=0,1, ….. and βj’s, j=1,2,…. are unknown constants; 1 is suitable
chosen positive integer; and εt is usual residual/error series.
We examine causal relationship between some form of inflation or
transformed price indices and Google search indices for relevant search
words. In particular, we considered two price indices, viz., CPI-C and CPI-U,
and two Google search indicators, viz., GMPrice and GMInfl.
Table 5: Predictive Power – Granger Causality
Google
F-
Search Null Hypothesis Obs Lag Statistics P-Value
Data
gGMPrice gGMPrice does not Granger Cause
gCPI-C 66 9 1.9125 0.0732
gCPI-C does not Granger cause 66 9 2.0230 0.0575
gGMPrice
gGMPrice does not Granger Cause 72 3 0.6434 0.5899
gCPI-U
gCPI-U does not Granger cause
gGMPrice 72 3 3.3392 0.0246
110 | I S I W S C 2 0 1 9