
Page 122 - Invited Paper Session (IPS) - Volume 2
P. 122
IPS 188 G. P. Samanta
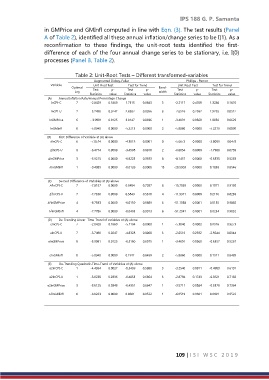
in GMPrice and GMInfl computed in line with Eqn. (3). The test results (Panel
A of Table 2), identified all these annual inflation/change series to be I(1). As a
reconfirmation to these findings, the unit-root tests identified the first-
difference of each of the four annual change series to be stationary, i.e. I(0)
processes (Panel B, Table 2).
Table 2: Unit-Root Tests – Different transformed-variables
Augmented Dickey-Fuller Phillips - Perron
Variable Unit-Root Test Test for Trend Unit-Root Test Test for Trend
Optimal Test p- Test p- Band- Test p- Test p-
Lag width
Statistics value Statistics value Statistics value Statistics value
(A) Annual Inflation Rate/Annual Percentage Change
InCPI-C 7 -2.8429 0.1869 1.7515 0.0843 3 -2.2117 0.4769 1.3288 0.1876
lnCPI-U 7 -3.7490 0.0247 2.8582 0.0056 3 -2.6516 0.2592 1.9785 0.0512
lnGMPrice 6 - 3.9981 0.0125 3.0147 0.0036 1 -3.4091 0.0569 1.8850 0.0629
lnGMInfl 0 -5.8940 0.0000 -5.2213 0.0000 2 -5.8860 0.0000 -5.2213 0.0000
(B) First-Difference of Variable at (A) above
∆lnCPI-C 6 -7.0514 0.0000 -4.3018 0.0001 0 -5.6672 0.0000 -2.0093 0.0478
∆lnCPI-U 6 -6.4774 0.0000 -3.4508 0.0010 2 -6.0054 0.0000 -1.7980 0.0759
∆lnGMPrice 3 -5.9215 0.0000 -0.9223 0.3593 8 -8.1457 0.0000 -0.6333 0.5283
∆lnGMInfl 1 -9.4089 0.0000 -0.0126 0.9900 13 -20.5903 0.0000 0.1838 0.8546
(C) Second-Difference of Variables at (A) above
2
∆ lnCPI-C 7 -7.8157 0.0000 0.3484 0.7287 8 -15.7029 0.0000 0.1071 0.9150
2
∆ lnCPI-U 7 -7.7350 0.0000 0.5843 0.5610 4 -11.9371 0.0000 0.2176 0.8283
∆ lnGMPrice 4 -8.7383 0.0000 -0.0139 0.9889 6 -51.1038 0.0001 0.0135 0.9892
2
∆ lnGMInfl 4 -7.7786 0.0000 -0.0493 0.9913 6 -51.2341 0.0001 0.0234 0.9852
2
(D) De-Trending Linear -Time-Trend of variables at (A) above
elnCPI-C 7 -2.8428 0.1869 -5.1194 0.0000 1 -5.3040 0.0002 0.0916 0.9273
elnCPI-U 7 -3.7490 0.0247 -4.8328 0.0000 3 -2.6516 0.2592 -2.9244 0.0044
elnGMPrice 6 -3.9981 0.0125 -0.5160 0.6075 1 -3.4091 0.0569 -0.6357 0.5267
elnGMInfl 0 -5.8940 0.0000 0.1911 0.8489 2 -5.8860 0.0000 0.1911 0.8489
(E) De-Trending Quadratic-Time-Trend of Variables at (A) above
e2lnCPI-C 1 -4.4954 0.0027 -0.5439 0.5880 3 -3.2540 0.0811 -0.4989 0.6191
e2lnCPI-U 1 -3.6238 0.0336 -0.4053 0.6864 3 -2.8794 0.1743 -0.3621 0.7182
e2lnGMPrice 3 -3.6125 0.0348 -0.4351 0.6647 1 -3.5711 0.0384 -0.3378 0.7364
e2lnGMInfl 0 -6.0223 0.0000 0.0601 0.9522 1 -6.0519 0.0601 0.0601 0.9522
109 | I S I W S C 2 0 1 9