
Page 236 - Invited Paper Session (IPS) - Volume 2
P. 236
IPS 224 Delina I.
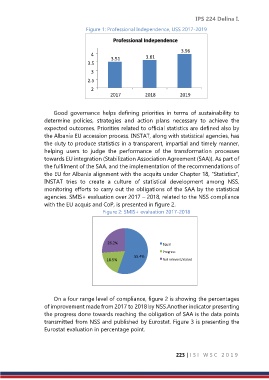
Figure 1: Professional Independence, USS 2017-2019
Professional Independence
4 3.96
3.51 3.61
3.5
3
2.5
2
2017 2018 2019
Good governance helps defining priorities in terms of sustainability to
determine policies, strategies and action plans necessary to achieve the
expected outcomes. Priorities related to official statistics are defined also by
the Albania EU accession process. INSTAT, along with statistical agencies, has
the duty to produce statistics in a transparent, impartial and timely manner,
helping users to judge the performance of the transformation processes
towards EU integration (Stabilization Association Agreement (SAA)). As part of
the fulfilment of the SAA, and the implementation of the recommendations of
the EU for Albania alignment with the acquits under Chapter 18, "Statistics",
INSTAT tries to create a culture of statistical development among NSS,
monitoring efforts to carry out the obligations of the SAA by the statistical
agencies. SMIS+ evaluation over 2017 – 2018, related to the NSS compliance
with the EU acquis and CoP, is presented in figure 2.
Figure 2: SMIS+ evaluation 2017-2018
26.2 % Equal
Progress
18.5 % 55.4 % Not relevant/stated
On a four range level of compliance, figure 2 is showing the percentages
of improvement made from 2017 to 2018 by NSS.Another indicator presenting
the progress done towards reaching the obligation of SAA is the data points
transmitted from NSS and published by Eurostat. Figure 3 is presenting the
Eurostat evaluation in percentage point.
223 | I S I W S C 2 0 1 9