
Page 451 - Invited Paper Session (IPS) - Volume 2
P. 451
IPS320 Tine Cordes et al.
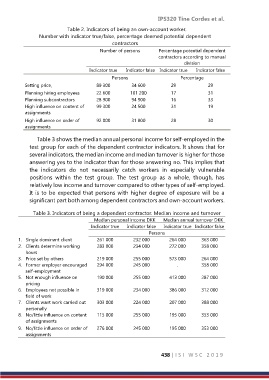
Table 2. Indicators of being an own-account worker.
Number with indicator true/false, percentage deemed potential dependent
contractors
Number of persons Percentage potential dependent
contractors according to manual
division
Indicator true Indicator false Indicator true Indicator false
Persons Percentage
1 Setting price, 89 300 34 600 29 29
2 Planning hiring employees 22 600 101 200 17 31
3 Planning subcontractors 28 900 94 900 16 33
4 High influence on content of 99 300 24 500 31 19
assignments
5 High influence on order of 92 000 31 800 28 30
assignments
Table 3 shows the median annual personal income for self-employed in the
test group for each of the dependent contractor indicators. It shows that for
several indicators, the median income and median turnover is higher for those
answering yes to the indicator than for those answering no. This implies that
the indicators do not necessarily catch workers in especially vulnerable
positions within the test group. The test group as a whole, though, has
relatively low income and turnover compared to other types of self-employed.
It is to be expected that persons with higher degree of exposure will be a
significant part both among dependent contractors and own-account workers.
Table 3. Indicators of being a dependent contractor. Median income and turnover
Median personal income DKK Median annual turnover DKK
Indicator true Indicator false Indicator true Indicator false
Persons
1. Single dominant client 261 000 232 000 264 000 363 000
2. Clients determine working 283 000 234 000 272 000 358 000
hours
3. Price set by others 219 000 255 000 573 000 264 000
4. Former employer encouraged 294 000 245 000 . 358 000
self-employment
5. Not enough influence on 190 000 255 000 413 000 287 000
pricing
6. Employees not possible in 319 000 234 000 386 000 312 000
field of work
7. Clients want work carried out 303 000 224 000 207 000 388 000
personally
8. No/little influence on content 115 000 255 000 195 000 353 000
of assignments
9. No/little influence on order of 276 000 245 000 195 000 353 000
assignments
438 | I S I W S C 2 0 1 9