
Page 61 - Invited Paper Session (IPS) - Volume 2
P. 61
IPS179 Wian B.
quantile cut-off values. For this purpose, only observations falling between the
20th and 90th percentile of the logarithmically transformed average transfer
values per month will be included. No seasonal adjustment will be made given
the limited sample size.
5. Discussion of Results
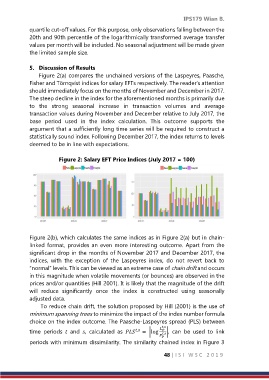
Figure 2(a) compares the unchained versions of the Laspeyres, Paasche,
Fisher and Törnqvist indices for salary EFTs respectively. The reader’s attention
should immediately focus on the months of November and December in 2017.
The steep decline in the index for the aforementioned months is primarily due
to the strong seasonal increase in transaction volumes and average
transaction values during November and December relative to July 2017, the
base period used in the index calculation. This outcome supports the
argument that a sufficiently long time series will be required to construct a
statistically sound index. Following December 2017, the index returns to levels
deemed to be in line with expectations.
Figure 2: Salary EFT Price Indices (July 2017 = 100)
Figure 2(b), which calculates the same indices as in Figure 2(a) but in chain-
linked format, provides an even more interesting outcome. Apart from the
significant drop in the months of November 2017 and December 2017, the
indices, with the exception of the Laspeyres index, do not revert back to
“normal” levels. This can be viewed as an extreme case of chain drift and occurs
in this magnitude when volatile movements (or bounces) are observed in the
prices and/or quantities (Hill 2001). It is likely that the magnitude of the drift
will reduce significantly once the index is constructed using seasonally
adjusted data.
To reduce chain drift, the solution proposed by Hill (2001) is the use of
minimum spanning trees to minimize the impact of the index number formula
choice on the index outcome. The Paasche-Laspeyres spread (PLS) between
, |, can be used to link
time periods and , calculated as , = |log ,
periods with minimum dissimilarity. The similarity chained index in Figure 3
48 | I S I W S C 2 0 1 9