
Page 77 - Invited Paper Session (IPS) - Volume 2
P. 77
IPS184 Sanvi Avouyi-Dovi et al.
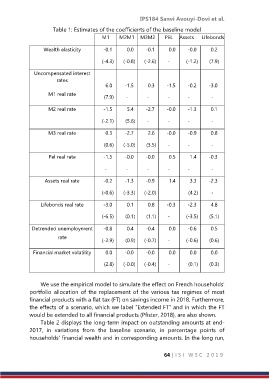
Table 1: Estimates of the coefficients of the baseline model
M1 M2M1 M3M2 PEL Assets Lifebonds
Wealth elasticity -0.1 0.0 -0.1 0.0 -0.0 0.2
(-4.3) (-0.8) (-2.6) - (-1.2) (7.9)
Uncompensated interest
rates
6.0 -1.5 0.3 -1.5 -0.2 -3.0
M1 real rate (7.9) - - - - -
M2 real rate -1.5 5.4 -2.7 -0.0 -1.3 0.1
(-2.1) (5.6) - - - -
M3 real rate 0.3 -2.7 2.6 -0.0 -0.9 0.8
(0.6) (-5.0) (3.5) - - -
Pel real rate -1.5 -0.0 -0.0 0.5 1.4 -0.3
- - - - - -
Assets real rate -0.2 -1.3 -0.9 1.4 3.3 -2.3
(-0.6) (-3.3) (-2.0) (4.2) -
Lifebonds real rate -3.0 0.1 0.8 -0.3 -2.3 4.8
(-6.5) (0.1) (1.1) - (-3.5) (5.1)
Detrended unemployment -0.8 0.4 -0.4 0.0 -0.6 0.5
rate (-2.9) (0.9) (-0.7) - (-0.6) (0.6)
rate
Financial market volatility 0.0 -0.0 -0.0 0.0 0.0 0.0
(2.8) (-0.0) (-0.4) - (0.1) (0.3)
We use the empirical model to simulate the effect on French households’
portfolio allocation of the replacement of the various tax regimes of most
financial products with a flat tax (FT) on savings income in 2018. Furthermore,
the effects of a scenario, which we label “Extended FT” and in which the FT
would be extended to all financial products (Pfister, 2018), are also shown.
Table 2 displays the long-term impact on outstanding amounts at end-
2017, in variations from the baseline scenario, in percentage points of
households' financial wealth and in corresponding amounts. In the long run,
64 | I S I W S C 2 0 1 9