
Page 116 - Special Topic Session (STS) - Volume 1
P. 116
STS410 Abdul Ghapor H. et al.
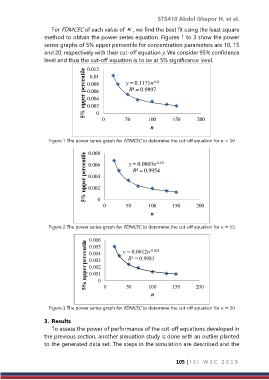
For FDMCEC of each value of , we find the best fit using the least square
method to obtain the power series equation. Figures 1 to 3 show the power
series graphs of 5% upper percentile for concentration parameters are 10, 15
and 20, respectively with their cut-off equation y. We consider 95% confidence
level and thus the cut-off equation is to be at 5% significance level.
0.012
5% upper percentile 0.008 y = 0.1171n -0.8
0.01
R² = 0.9897
0.006
0.004
0.002
0
0 50 100 150 200
n
Figure 1 The power series graph for FDMCEC to determine the cut-off equation for = 10
0.008
5% upper percentile 0.006 y = 0.0803n -0.82
R² = 0.9954
0.004
0.002
0
0 50 100 150 200
n
Figure 2 The power series graph for FDMCEC to determine the cut-off equation for = 15
Figure 3 The power series graph for FDMCEC to determine the cut-off equation for = 20
3. Results
To assess the power of performance of the cut-off equations developed in
the previous section, another simuation study is done with an outlier planted
to the generated data set. The steps in the simulation are described and the
105 | I S I W S C 2 0 1 9