
Page 119 - Special Topic Session (STS) - Volume 1
P. 119
STS410 Abdul Ghapor H. et al.
circular statistics such as Mokhtar et al. (2018), Abuzaid et al. (2008), Hussin et
al. (2010) and Satari (2015) have used this data to illustrate the presence of
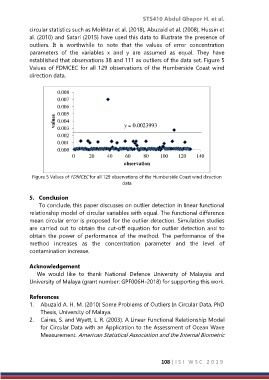
outliers. It is worthwhile to note that the values of error concentration
parameters of the variables x and y are assumed as equal. They have
established that observations 38 and 111 as outliers of the data set. Figure 5
Values of FDMCEC for all 129 observations of the Humberside Coast wind
direction data.
0.008
0.007
0.006
values 0.005 y = 0.0023993
0.004
0.003
0.002
0.001
0.000
0 20 40 60 80 100 120 140
observation
Figure 5 Values of FDMCEC for all 129 observations of the Humberside Coast wind direction
data
5. Conclusion
To conclude, this paper discusses on outlier detection in linear functional
relationship model of circular variables with equal. The functional difference
mean circular error is proposed for the outlier detection. Simulation studies
are carried out to obtain the cut-off equation for outlier detection and to
obtain the power of performance of the method. The performance of the
method increases as the concentration parameter and the level of
contamination increase.
Acknowledgement
We would like to thank National Defence University of Malaysia and
University of Malaya (grant number: GPF006H-2018) for supporting this work.
References
1. Abuzaid A. H. M. (2010) Some Problems of Outliers In Circular Data, PhD
Thesis, University of Malaya.
2. Caires, S. and Wyatt, L. R. (2003). A Linear Functional Relationship Model
for Circular Data with an Application to the Assessment of Ocean Wave
Measurement. American Statistical Association and the Internal Biometric
108 | I S I W S C 2 0 1 9